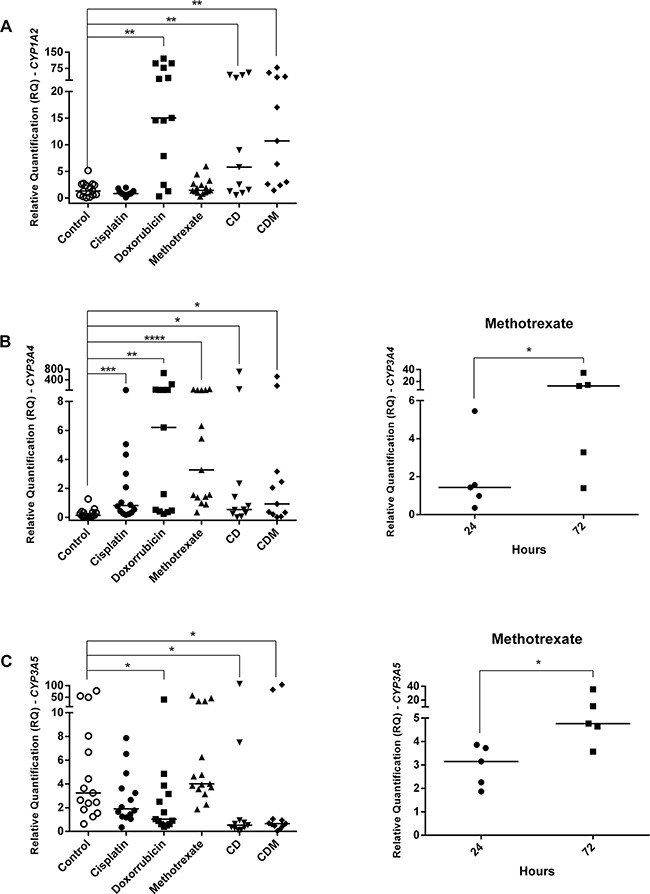
Figure 4. CYPs gene expression in OS cell lines treated with cisplatin, doxorubicin, methotrexate, cisplatin plus doxorubicin (CD), and cisplatin plus doxorubicin plus methotrexate (CDM).

A. CYP1A2 upregulation by doxorubicin, CD and CDM treatments. B. CYP3A4 upregulation by cisplatin, doxorubicin, methotrexate, CD and CDM treatments, whereas upregulation by methotrexate was time-dependent. C. CYP3A5 downregulation by doxorubicin, CD and CDM treatments, whereas methotrexate upregulated in a time-dependent manner. Statistical significance by Mann-Whitney and Wilcoxon: *: p<0.05; **: p<0.01; ***: p<0.001; ****: p<0.0001.
