
Figure 1. Laminarin-induced activation of spleen DCs in vivo.
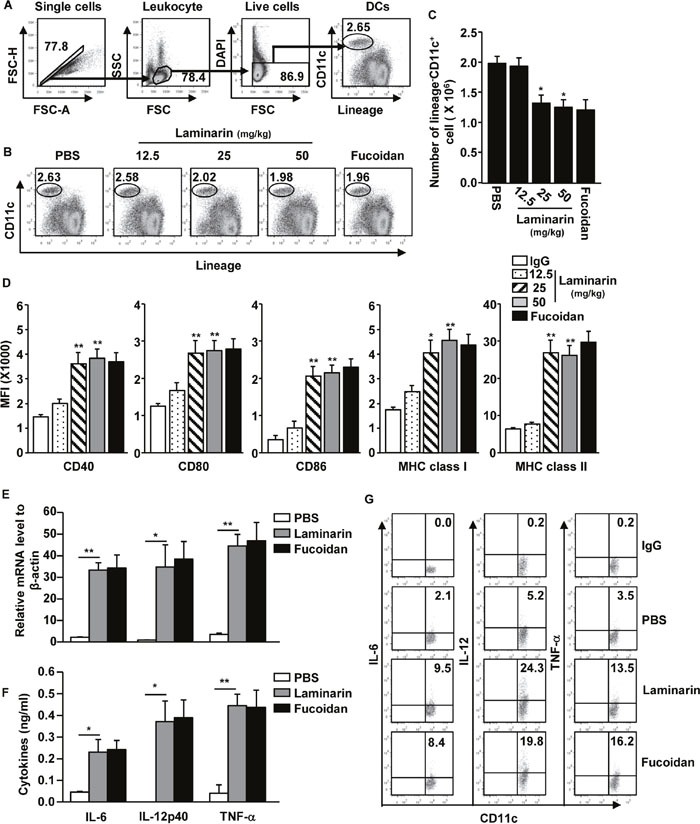
C57BL/6 mice were injected intravenously (i.v.) with 12.5, 25, and 50 mg/kg of laminarin and 10 mg/kg of fucoidan for 24 hours before the spleens were harvested. (A) Definition of spleen DCs. Lineage markers included CD3, Thy1.1, B220, Gr-1, CD49b, and TER-119. (B) Percentages of lineage−CD11c+ DCs in the spleens. (C) Mean of the absolute numbers of lineage−CD11c+ spleen DCs within live cells. (D) Mean fluorescence intensity (MFI) of co-stimulatory molecules and MHC classes I and II in gated lineage−CD11c+ cells from the spleens were analyzed using flow cytometry. (E) mRNA levels. (F) Sera concentration of IL-6, IL-12p70, and TNF-α. (G) Intracellular IL-6, IL-12, and TNF-α production in spleen DCs. All data are representative of or the average of analyses of six independent samples (two mice per experiment, totaling three independent experiments). *p < 0.05, **p < 0.01.