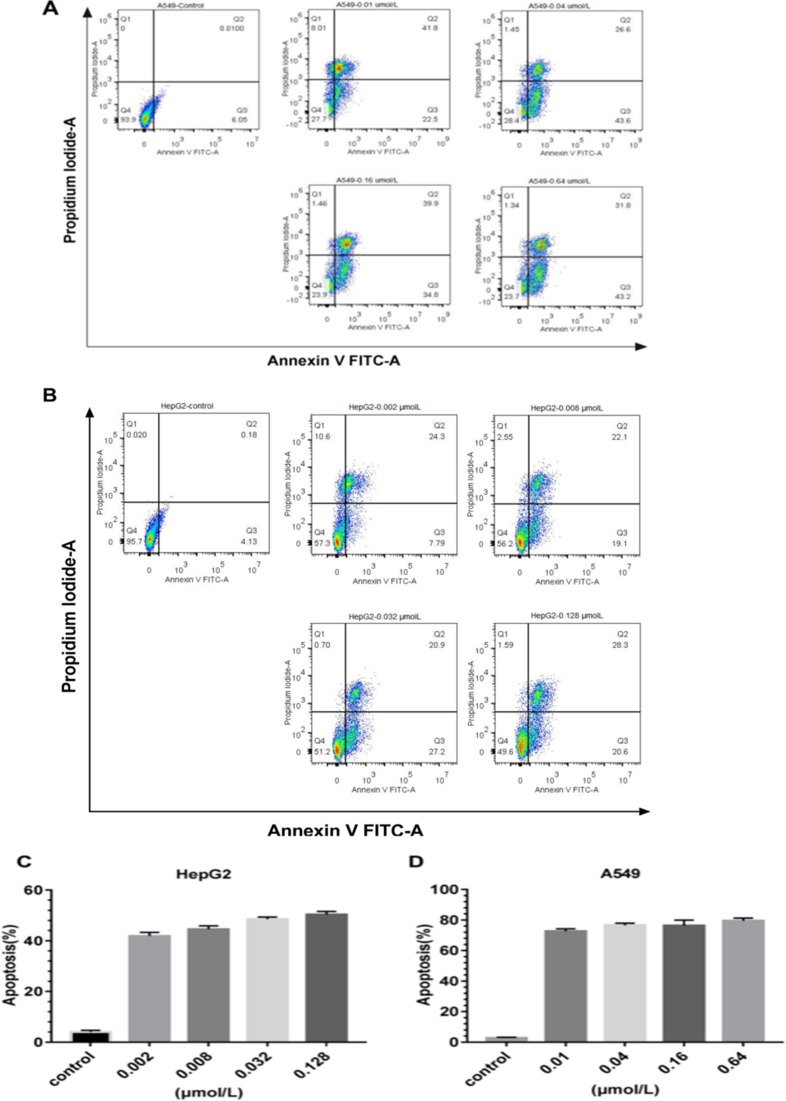
Figure 7. Apoptosis analysis of the immunotoxins rE/CUS.
(A) on A549, which incubated with 0.01, 0.04, 0.16 and 0.64μmol/L of rE/CUS for 72 h, dot blots and the percentage of the four quadrants. (B) on HepG2, which was incubated with 0.002, 0.008, 0.032, and 0.128 μmol/L of rE/CUS for 72 h, dot blots and the percentage of the four quadrants. (C and D) Early and late apoptosis or necrosis was combined in a column diagram foreach cell line for A549 and HepG2.

