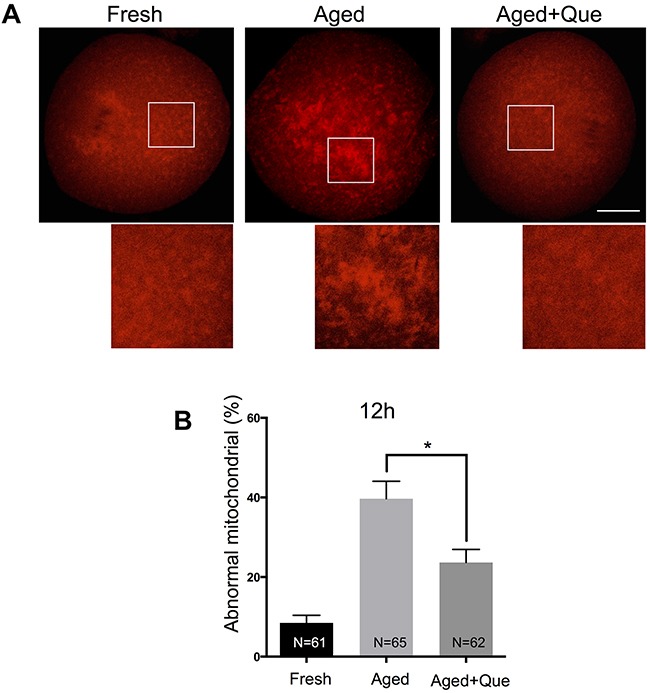
Figure 5. Effects of quercetin on mitochondrial distribution during postovulatory aging.

(A) Representative images of mitochondrial distribution in fresh, aged, and quercetin-treated MII oocytes. Scale bar: 20 μm. Que: quercetin. (B) The proportion of abnormal mitochondrial morphology in control oocytes or quercetin-treated oocytes after 12 h and 24 h of aging, respectively. Data are expressed as mean ± SEM of at least three independent experiments. *p < 0.05.
