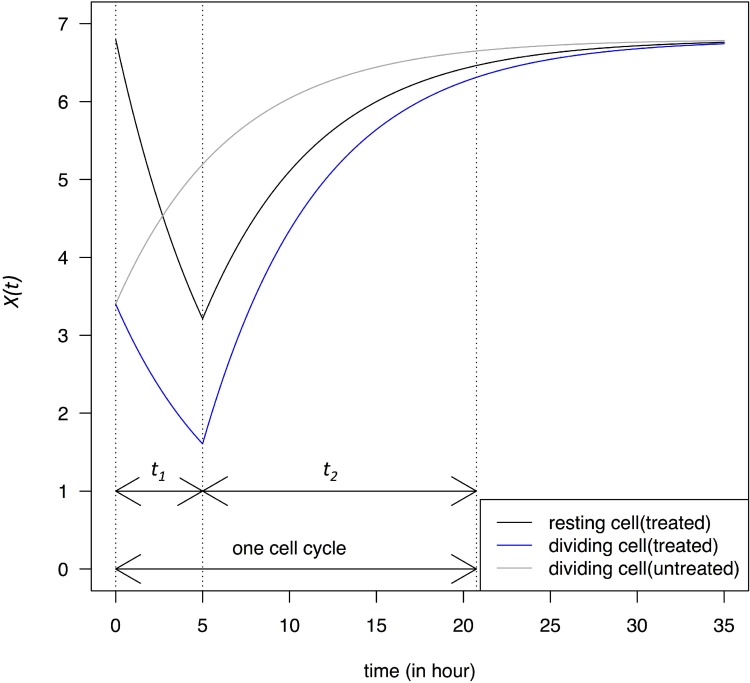
Figure 1. Change in transcript abundance per cell, X(t), in a single cell cycle.
At time 0, dividing cells enter the G1 phase and X(0) = ½ Xeq. Cells are either untreated or treated with a transcription-blocking agent for a period of t1, followed by a recovery phase that lasts for a period of t2 until the end of the cell cycle. At the end of t1, X(t) of the resting cells is ½ Xeq. The dynamics is described in Eqs. 2 – 2.2. Dividing cells are assumed to have a cell cycle time of 20 hours close to the limit of most cell lines.

