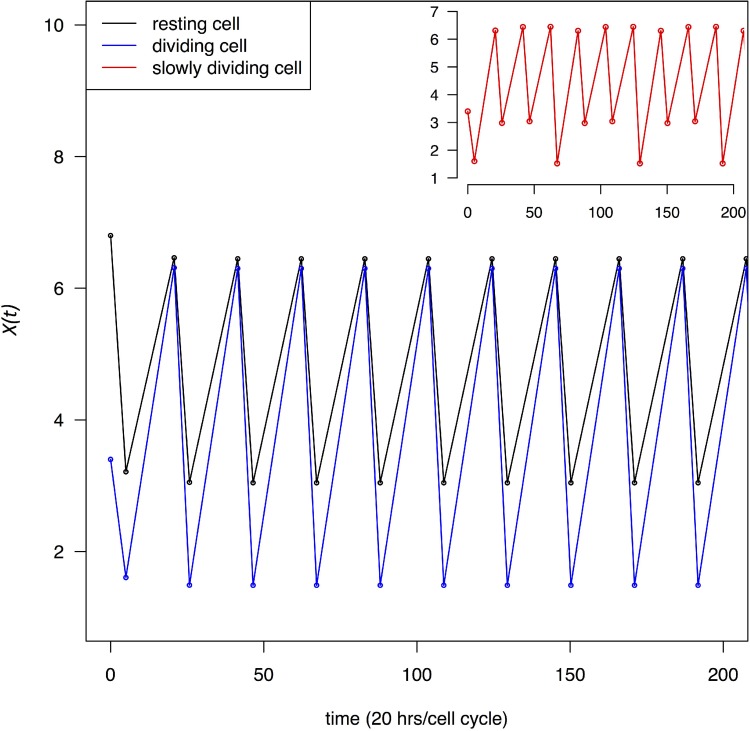
Figure 2. Change in transcript abundance per cell, X(t), through multiple cell cycles.
Both dividing and resting cells are treated with a transcription blocking agent as in Figure 1. X(t) oscillates between a high and low value in each cycle which quickly converges to XH and XL defined by Eqs (3–6). Black and blue lines trace X(t) for resting and dividing cells respectively. In the inset, the red line trace cells that divide at 1/3 of the maximal rate.

