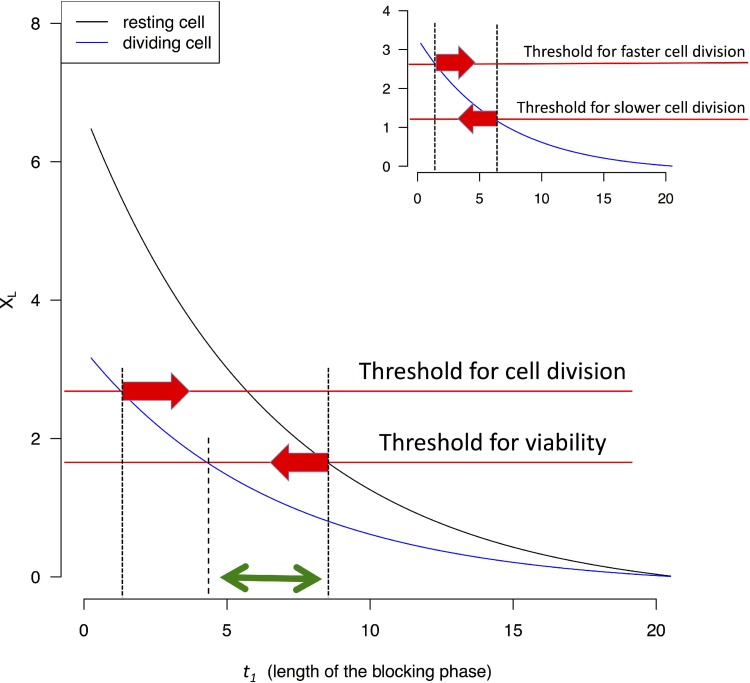
Figure 3. XL value (Eq. 4 and 6) as a function of the length of the blocking phase (t1).
Two thresholds are assumed below which cells either do not divide or cannot survive. The two thresholds can be the same without affecting the qualitative conclusion. When XL drops below the threshold, cells are assumed to be unable to divide, or survive. The interval between the two red arrows indicates possible t1 values that permit resting cells to survive but prevent non-resting cells to divide. The green arrow indicates a smaller interval for t1 which would not permit dividing cells to survive (see text). In the inset, the comparison is between fast and slowly dividing cells. It is assumed that slowly dividing cells have a lower threshold for X(t) for cell survival since they are stressed much less often.

