Figure 2.
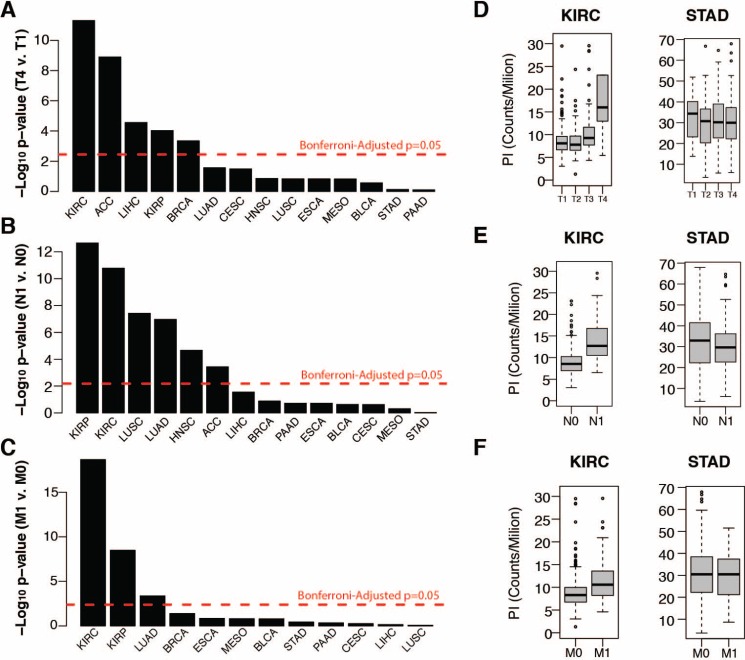
(A–C) Wilcox test negative log p-values of tumor proliferation comparisons between (A) tumor T stages 1 and 4, (B) tumor N stages 0 and 1 (nodal invasion), and tumor M stages 0 and 1 (metastasis) (C). (D–F) Distribution of tumor proliferation index across tumor T (D), N (E) and M stages for TCGA renal cell carcinoma (KIRC) and stomach adenocarcinoma (STAD).

