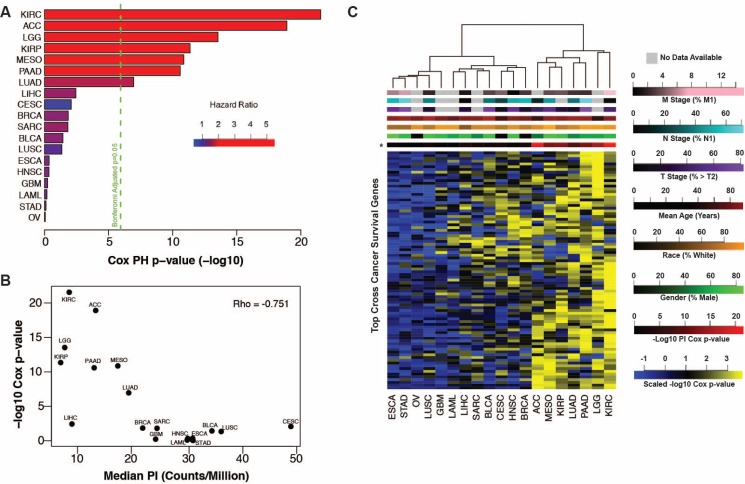
Figure 3.
(A) Tumor proliferative index Cox regression negative log p-values plotted by cancer with the first seven cancers showing significant association with patient outcome. (B) Tumor proliferation index survival associations (Cox regression negative log p-values) are anti-correlated with the median tumor proliferation index of each cancer. (C) Heatmap of negative log Cox regression p-values of genes significant (p < 0.05, n = 84) in at least 9 of 19 cancers identifies PICs (right).

