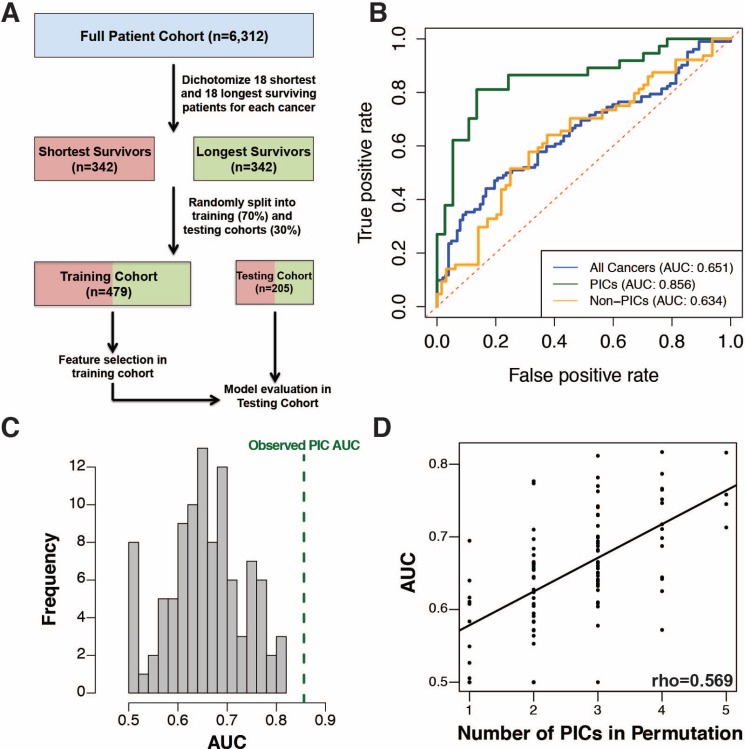
Figure 4.
(A) Workflow for cross-cancer survival model generation. (B) ROC curve for multivariate Cox regression with LASSO for variable selection on all 19 cancers (blue), PICs only (green) and non-PICs only (orange). (C) Histogram showing the distribution of ROC curve AUC values for survival models generated on 100 randomly sampled sets of cancers equivalent in number to the PICs. (D) The ROC curve AUC values are directly proportional to the number of PICs included in random sample sets.

