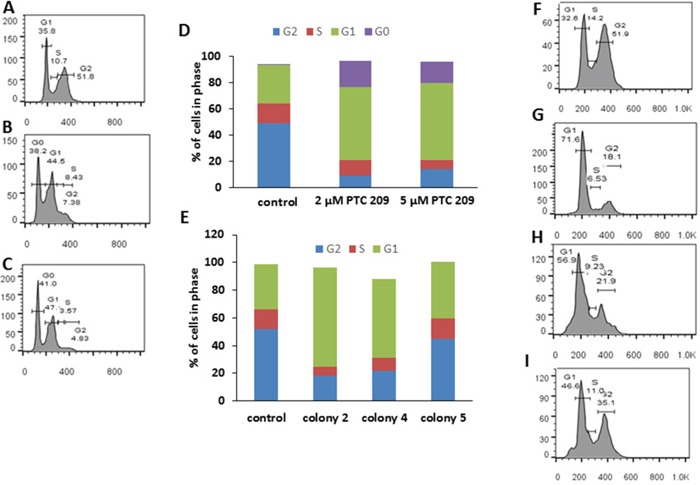
Figure 2. Bmi1 downregulation causes cell cycle arrest.

(A) Untreated (control) FMMC 419II cells. (B) Cells treated with 2 μM PTC 209. (C) Cells treated with 5 μM PTC 209. (D) Results of PTC 209 treatment shown as bar graphs. There is a G0/G1 cell cycle arrest in FMMC 419II cells treated with PTC 209 when compared to untreated cells. Similarly, FMMC 419II cells that have been transfected with a Bmi1 shRNA show a G1 arrest. (E) Bar graphs of cell cycle profiles for FMMC 419II cells from control (F), colony 2 (G), colony 4 (H), and colony 5 (I). Cells stained with PI/RNAse staining buffer were run on a FACSAria flow cytometer and cell cycle progression was analyzed and quantified (D, E) using FlowJo.
