
Figure 1. Establishment of highly invasive ESCC sublines.
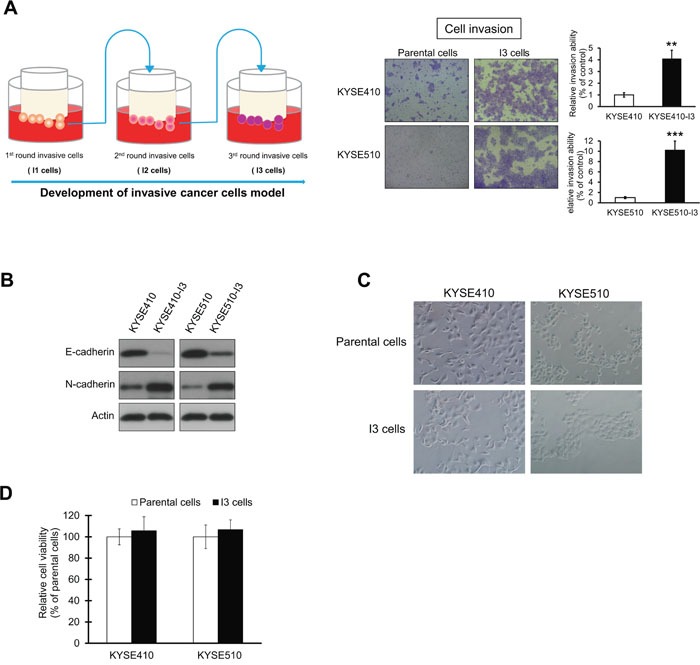
(A) Matrigel chamber invasion assay comparing the invasive potential of KYSE410-I3 and KYSE410-I3 sublines with that of corresponding parental cells. The quantification data show dramatic increase in invasive potential of I3 cells. (B) Comparison of E-cadherin and N-cadherin expressions in I3 cells and parental cells. (C) Morphology of I3 cells and parental cells. (D) Parental and I3 cells had similar proliferation rates as determined by MTT assay. Bars, SD; **, P < 0.01; ***, P < 0.001 compared with control cells.