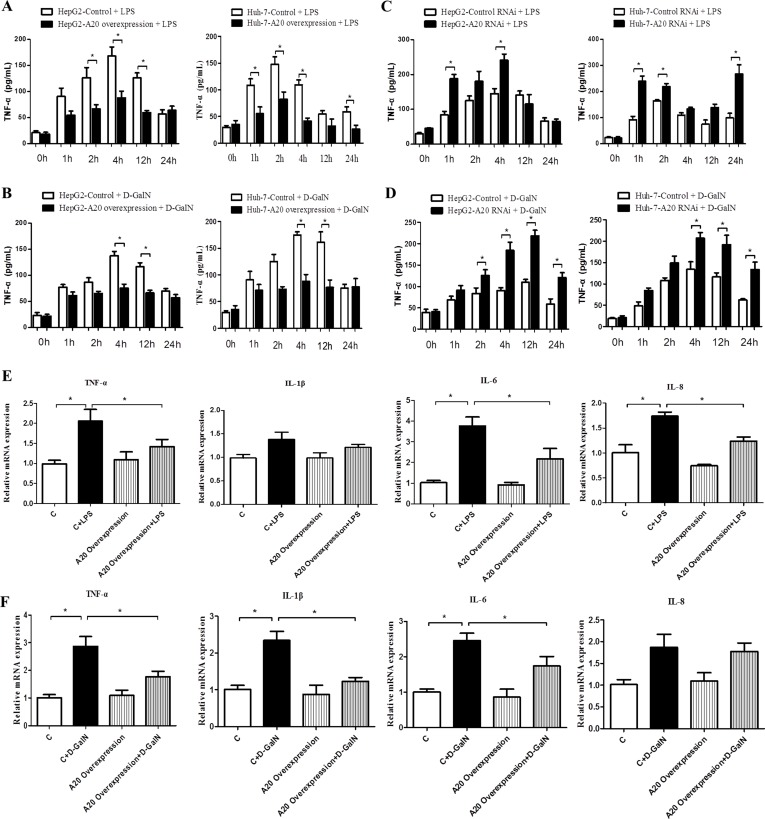
Figure 6. A20 affects the expression and secretion of inflammatory cytokines.
(A–D) Dynamic change of TNF-α level in the culture supernatant of HepG2 and Huh-7 cells with A20-overexpression or A20-knockdown after treatment with LPS (1ug/mL) or D-GalN (20 mmol/L), n = 3 per group. (E) Real-time PCR analysis of the expression of pro-inflammatory cytokines TNF-α, IL-1β, IL-6 and IL-8 in A20-overexpression HepG2 cells or controls after treatment of LPS or D-GalN for 24 hours, n = 3–4 per group. (F) Expression of pro-inflammatory cytokines in A20-overexpression Huh-7 cells or controls after treatment of LPS or D-GalN for 24 hours. Data are expressed as mean ± SD, n = 3–4 per group, *P < 0.05 vs. control.

