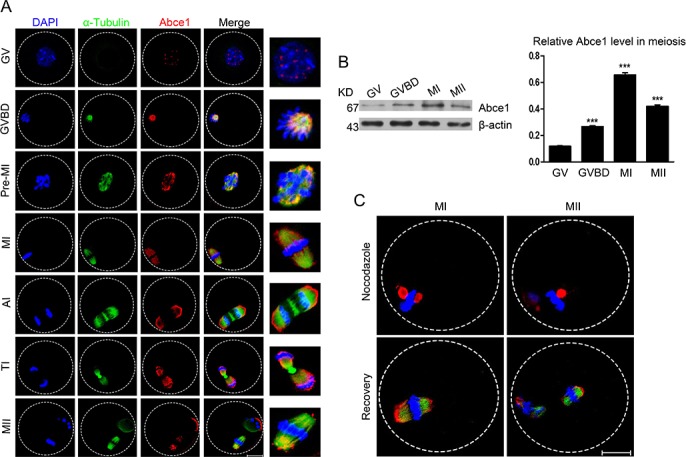
Figure 1. Cellular localization and expression of Abce1 during mouse oocyte maturation.

(A) Cellular localization of Abce1 detected by immunofluorescent analysis. Oocytes at indicated stages were immunostained for Abce1 (red), microtubule (α-tubulin; green) and DNA (blue). Magnification of the boxed regions showed relationship of Abce1 with the spindle. (B) Expression of Abce1 during mouse oocyte meiotic maturation. Oocytes were collected after 0, 2, 8, or 14 h in culture, corresponding to GV, GVBD, MI, and MII stage, respectively. The molecular weight of Abce1 and β-actin were 67 kD and 43 kD, respectively. Normalized signal intensity of Abce1 was presented in the right panel. (C) Confocal images of Abce1 signal after treatment with nocodazole. Oocytes at indicated stage were double stained for Abce1 (red), α-tubulin (green) and DNA (blue). Data were presented as mean percentage (mean ± SEM) of at least three independent experiments. ***p < 0.001. Scale bar, 20 μm.
