
Figure 4. CD47 expression is elevated in the ovarian cancer stem cell-like population.
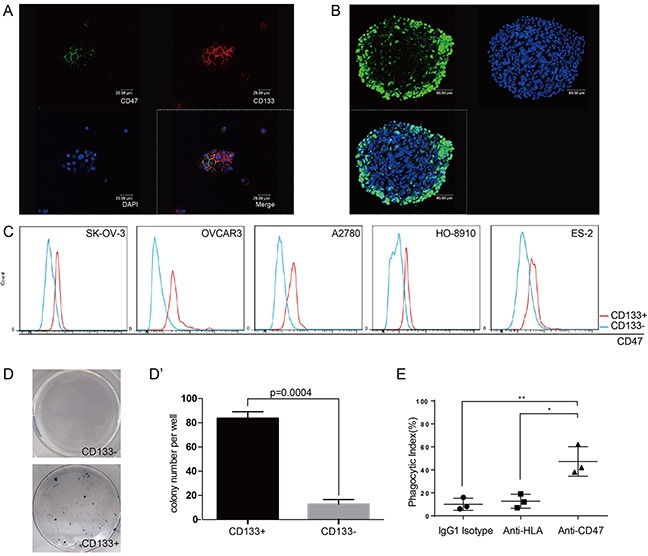
(A) Tumor cells obtained from patient ascites samples were used for sphere forming assays. CD47 and CD133 expression on the spheres was analyzed by immunofluorescence staining (scale bar = 20 μm). (B) Ovarian cancer sphere cells showed aldehyde dehydrogenase (scale bar = 20 μm). (C) The CD47 expression levels in CD133+ and CD133− sub-populations was measured by mean fluorescence intensity in 5 epithelial ovarian cancer cell lines. (D) Representative colony formation assay for HO-8910 CD133+ and CD133− sub-populations. (D') The number of colonies was quantified and plotted (Unpaired Student's-t-test, two-tailed, **p < 0.005). (E) The anti-CD47 mAb promoted phagocytosis of the CD133+ sub-population of cells isolated from the HO-8910 cell line by macrophages.