
Figure 2. OVOL2 is a candidate EMT suppressor during mammary tumor metastasis.
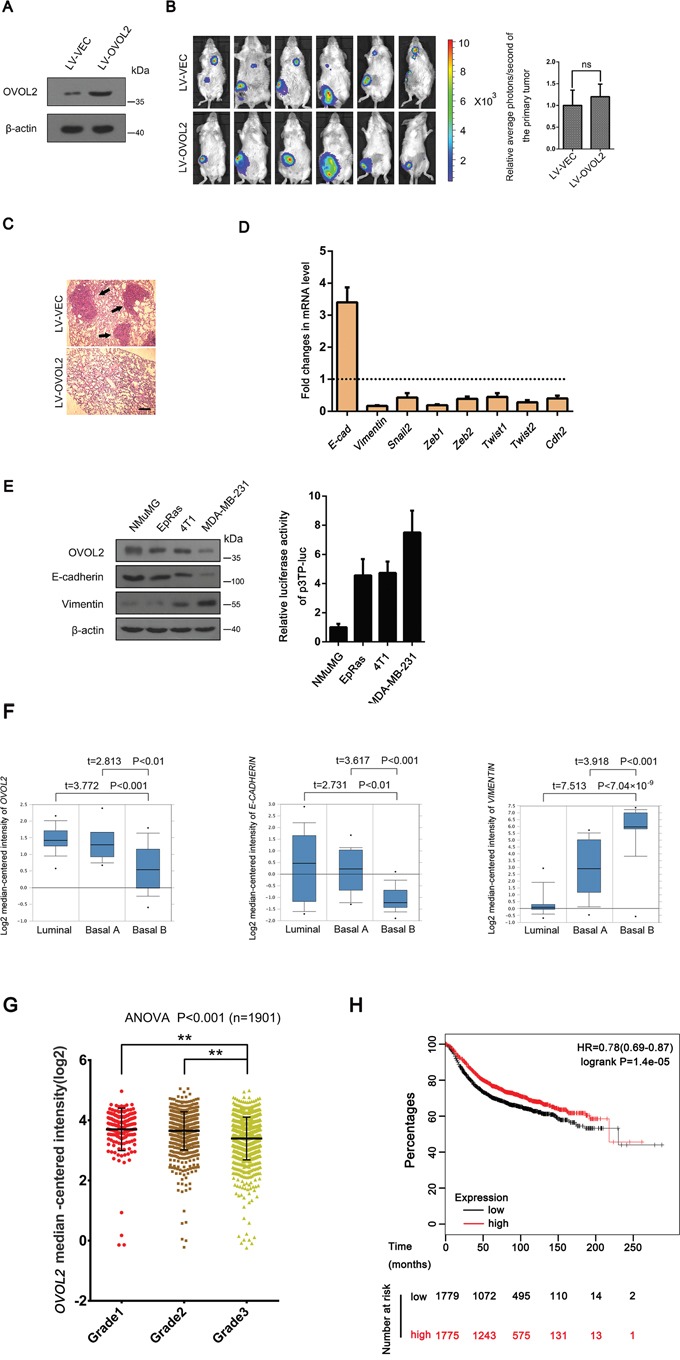
(A) Western blotting was used to detect the OVOL2 protein levels in 4T1 cells infected with lentiviruses expressing a vector control (LV-VEC) and OVOL2(LV-OVOL2). (B) Left, bioluminescence imaging of lung-metastatic breast cancer 4T1 cells at 5 weeks post implantation (5 × 10⁵ cells by orthotopic injection in the fourth mammary gland of BALB/c mice) demonstrating the effects of OVOL2 on the metastatic ability of 4T1 cells. Right, effects of OVOL2 overexpression on the primary tumors. Luciferase expression is depicted as region of interest (ROI-photons/s) in mice orthotropic implantation tumors. Data are the means ± SD, n=6 (ns, not significant). (C) Histological examination results for metastatic tumors in the lung (black arrows indicated). Scale bar, 400 μm. (D) Quantitative real-time PCR was used to measure the mRNA levels of EMT-related genes in control and OVOL2 overexpressing primary tumors. The real-time PCR values were normalized to the housekeeping gene Gapdh. The experiments were performed in technical triplicate. The data are presented as the mean ± SD. (E) Western blotting was used to detect the protein levels of OVOL2, E-cadherin and Vimentin in NMuMG, EpRas, 4T1 and MDA-MB-231 cells, and p3TP-luc was transfected into NMuMG, EpRas, 4T1 and MDA-MB-231 cells to measure the basic TGF-β signaling activity. Data are expressed as the mean ± SD of three independent experiments. (F) OVOL2 is downregulated in cell lines that have undergone EMT. OVOL2 (left) and E-CADHERIN (middle) are downregulated, whereas VIMENTIN (right) is upregulated in the “basal-B” subclass of breast cancer cell lines reported by Neve and colleagues (Oncomine database). Note, this is the only cohort that divides all the breast cancer cell lines into luminal, Basal A and basal B groups. (G) OVOL2 mRNA decreased with human breast cancer progression from grade 2 to grade 3. The data were obtained from the Curtis breast dataset of the Oncomine database and are presented as the mean ± SEM. t-test, **P< 0.01. (H) Kaplan–Meier survival curve for relapse-free survival from the KM plotter database. All the patients were separated from middle and defined as high and low OVOL2 expression groups. Proportion of relapse-free cases at different time after surgery was shown. Note, the cases of low OVOL2 expression group (1779) are more than the high OVOL2 expression group (1775), because the OVOL2 expression levels in 4 cases at the middle position are the same.