
Figure 3. OVOL2 upregulates Smad7 and downregulates Smad4 to inhibit the TGF-β signaling pathway.
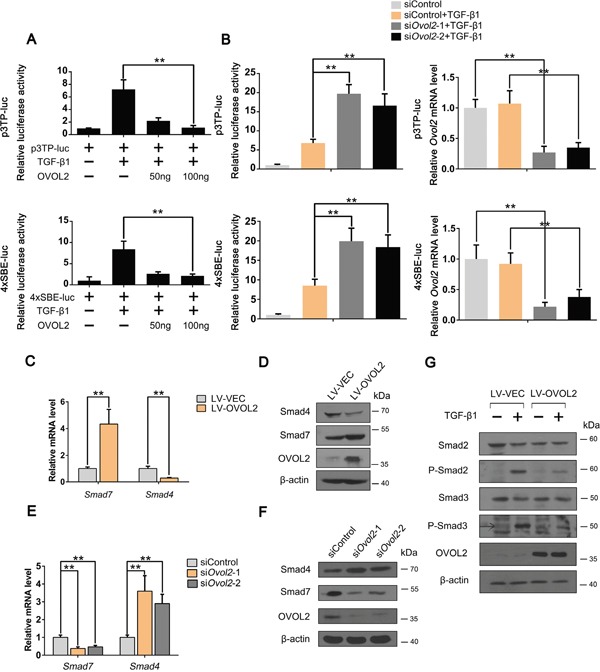
(A) Effects of OVOL2 overexpression on TGF-β signaling, as determined by using p3TP-luc (top) and 4xSBE-luc (bottom) luciferase reporters in NMuMG cells. The data are expressed as the mean ± SD of three independent experiments. **P< 0.01. (B) Effects of Ovol2 knockdown on TGF-β signaling, as determined by using p3TP-luc (top) and 4xSBE-luc (bottom) luciferase reporters in NMuMG cells. The knockdown efficiency of the endogenous Ovol2 mRNA level is shown in the right panel. The data are expressed as the mean ± SD of three independent experiments. **P< 0.01. (C) Quantitative real-time PCR was performed to measure the mRNA levels of Smad4 and Smad7 in control and OVOL2 overexpressing 4T1 cells. The real-time PCR values were normalized to the housekeeping gene Gapdh. The experiments were performed three times with real-time PCR performed in technical triplicate. Data are presented as the mean ±SD. **P < 0.01, as indicated by Student's t test. (D) Western blotting was performed to detect the protein levels of OVOL2, Smad4 and Smad7 in control and OVOL2 overexpressing 4T1 cells. (E) Quantitative real-time PCR was performed to measure the mRNA levels of Smad4 and Smad7 in 4T1 cells transfected with control or Ovol2 siRNA. The experiments were performed three times, each with real-time PCR performed in technical triplicate, and the data are presented as the mean ± SD. **P < 0.01, as indicated by Student's t test. (F) Western blotting was performed to detect the protein levels of Ovol2, Smad4 and Smad7 in 4T1 cells transfected with control or Ovol2 siRNA. (G) Western blotting was performed to detect the protein levels of Smad2, Smad3, P-Smad2 and P-Smad3 in control and OVOL2 overexpressing NMuMG cells.