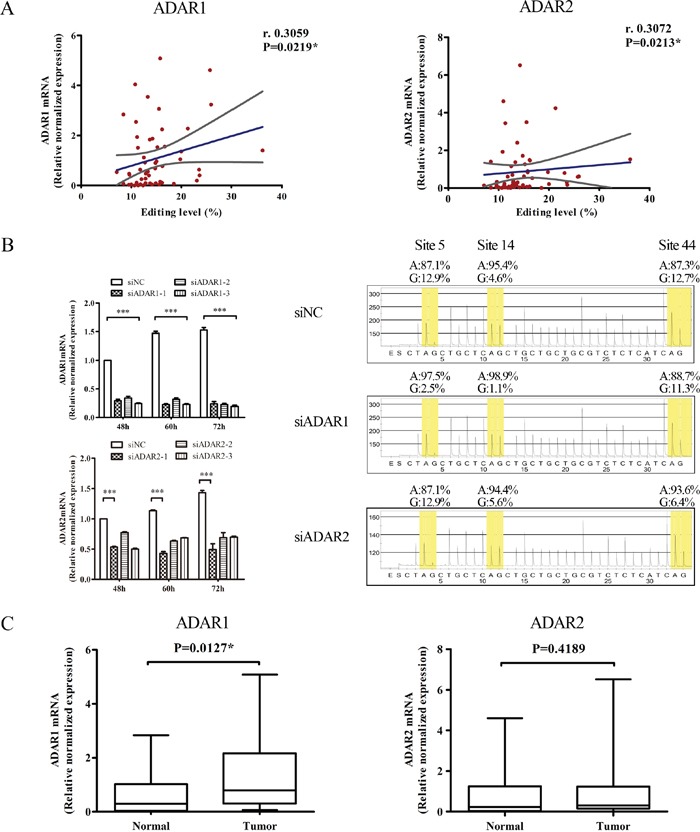
Figure 3. ADAR1 plays an important role in BLCAP A-to-I RNA editing.

(A) Correlations between BLCAP editing levels and the relative normalized mRNA levels of ADAR1 (left), ADAR2 (right) of 28 paired cervical specimens (56 individual samples), respectively. Blue lines represented linear regression, and grey lines represented the 95% confidence interval (Spearman correlation coefficients test, *P<0.05). Editing level in Figure 3 defined as the edited reads to total reads in each sample. (B) Three types of siADAR1, siADAR2 and siNC were transfected into HeLa cells and harvested after 48-72 hours. Cells were conducted with realtime-PCR and pyrosequencing assays. In the sequencing figures, yellow part represents the frequencies of original adenosine (A) and edited guanosine (G). Bases were skipped when there was no signal and overlapped when adjacent bases were the same. (C) Relatively expression of ADAR1 and ADAR2 between cervical cancer tissues (Tumor) and matched non-tumor tissues (Normal). The data are presented as box plots with media (horizontal line), 25-75% (box) and 5-95% (error bar) percentiles for each group (Related-samples Wilcoxon Signed Rank Test, *P<0.05).
