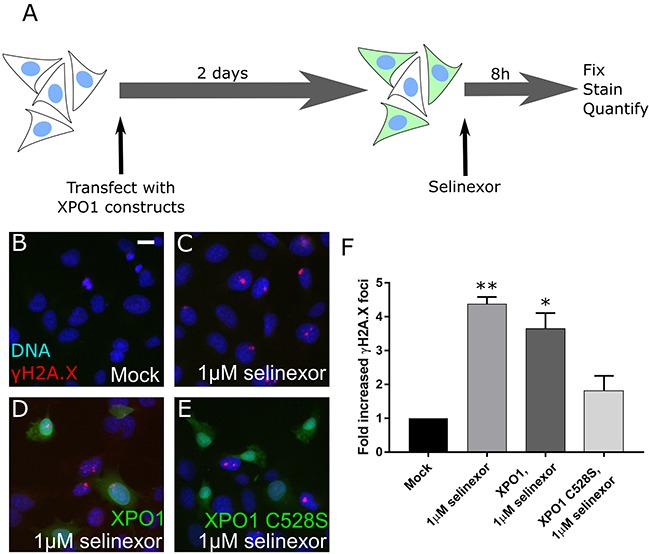
Figure 3. DNA damage foci formation after SINE treatment requires XPO1 binding.

(A) Experimental scheme. Cells are transfected, treated, and the DNA damage formation is quantified. (B, C) HT-1080 cells were mock transfected or (D) transfected with XPO1-RFP or (E) XPO1 C528S-RFP expression plasmids. Cells were treated with DMSO (mock) or 1μM selinexor for 8 hours. Cells were fixed and stained for γH2A.X (red) and DNA (blue). Transfected cells are shown in green. (F) The mean fold increase in DNA damage foci over mock was quantified. Error bars are the SEM from two replicate experiments, at least 50 cells scored in each. ** is p<0.01 and * is p<0.05 compared to mock. Scale bar in B = 10μm for all panels.
