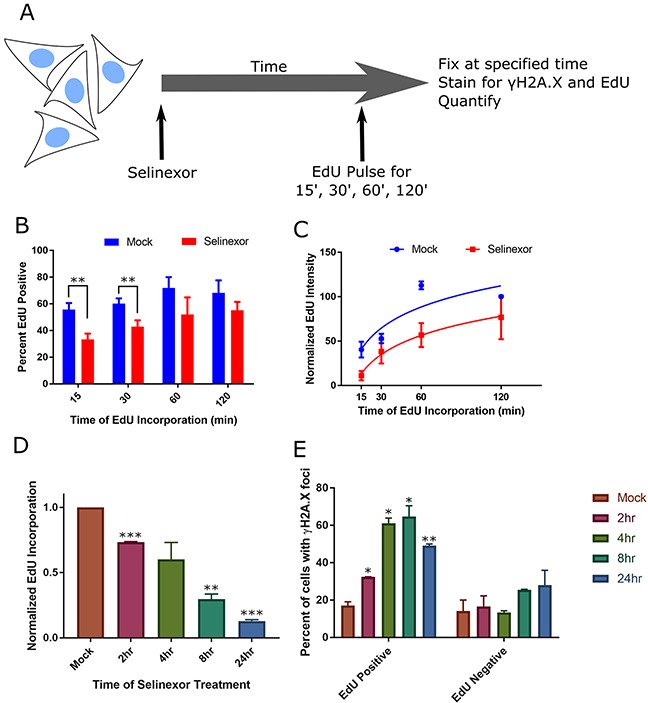
Figure 4. Cells with DNA damage foci associate strongly with S-phase and S-phase progression defects.

(A) Experimental scheme. Cells are pulse-labeled with EdU for varying times at the end of treatment, and quantified. (B, C) HT-1080 cells were treated with DMSO (mock) or 1μM selinexor for 8hours (h) and pulse-labeled with EdU for the last 15, 30, 60, or 120 minutes (m). Cells were fixed and costained for γH2A.X, DNA and EdU. Please see Supplementary Figure 7 for representative images. (B) The mean percentage of EdU positive cells after 8h selinexor is decreased compared to mock, regardless of EdU pulse length. Error bars are the SEM from three replicate experiments, at least 100 cells scored for each time point. (C) The mean integrated EdU signal intensity per cell is decreased after 8h of 1μM selinexor even after long EdU incorporation times. Error bars are SEM from three replicate experiments, at least 100 cells scored for each time point. (D, E) HT-1080 cells were treated with 1μM selinexor for 2, 4, 8, and 24h are labeled with EdU for the final 15m of each time point. (D) The mean fluorescence of EdU decreases as the duration of treatment increases. Error bars are the SEM from two replicate experiments, at least 100 cells measured for each time point. (E) The population of analyzed cells was divided into two groups, EdU positive and EdU negative. γH2A.X foci were identified and the percentage of cells in each group with foci was quantified. EdU positive cells show damage foci more frequently than EdU negative cells. After 8h of selinexor treatment, 70% of EdU positive cells show foci compared to 25% of EdU negative cells. Error bars are the SEM from two replicate experiments, at least 100 cells measured for each time point. *** is p<0.001, ** is p<0.01 and * is p<0.05.
