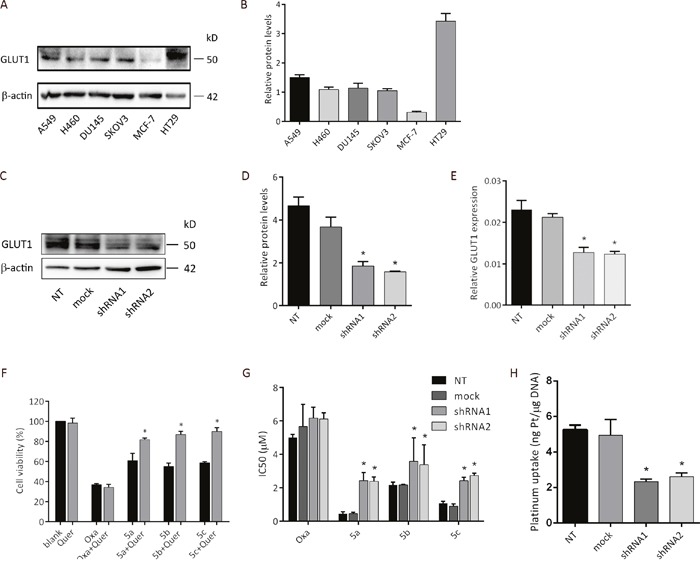
Figure 5. Cellular uptake mechanism of the platinum complexes.

(A) Expression of GLUT1 in various cancer cell lines determined by western blot analysis. (B) Bar graph for the quantitative comparison among GLUT1 expression levels. (C) GLUT1 expression levels in empty vector transfected and shGLUT1-transfected cells confirmed by western blot. (D) Bar graph for the quantitative comparison among GLUT1 expression levels in empty vector transfected and shGLUT1-transfected cells. (E) RT-PCR analysis of GLUT1 mRNA expression in empty vector transfected and shGLUT1-transfected cells. NT: HT29 cells; mock: HT29 cells transfected by empty vector pLKO.1; shRNA1: HT29 cells transfected by shGLUT1-1 and selected by 1 μg/mL of puromycin; shRNA2: HT29 cells transfected by shGLUT1-2 and selected by 1 μg/mL of puromycin. (F) Cytotoxicity of oxaliplatin and glucose conjugated platinum complexes against HT29 human colon cancer cell line in the presence and in the absence of GLUT1 inhibitor quercetin. MTS assay showing cell viability of HT29 after treated with oxaliplatin and glucose conjugated platinum complexes (100 μM) alone or together with quercetin (20 μM) for 48h. HT29 exposed with PBS or quercetin alone were served as negative control. (G) HT29, HT29-mock and HT29 transfected by shGLUT1 cells were treated with oxaliplatin and three sugar-conjugated platinum complexes for 72h, and the IC50 values were determined by the MTS assay. (H) Platinum uptake after 2 h treatment of compound 5a at 200 μM. Data was calculated from three independent experiments. *P < 0.05, compared to the control group.
