
Figure 2. Forest plot for pooled ORs for the associations between allele model (H allele vs N allele) of rs144844 and cancer risk in the overall population.
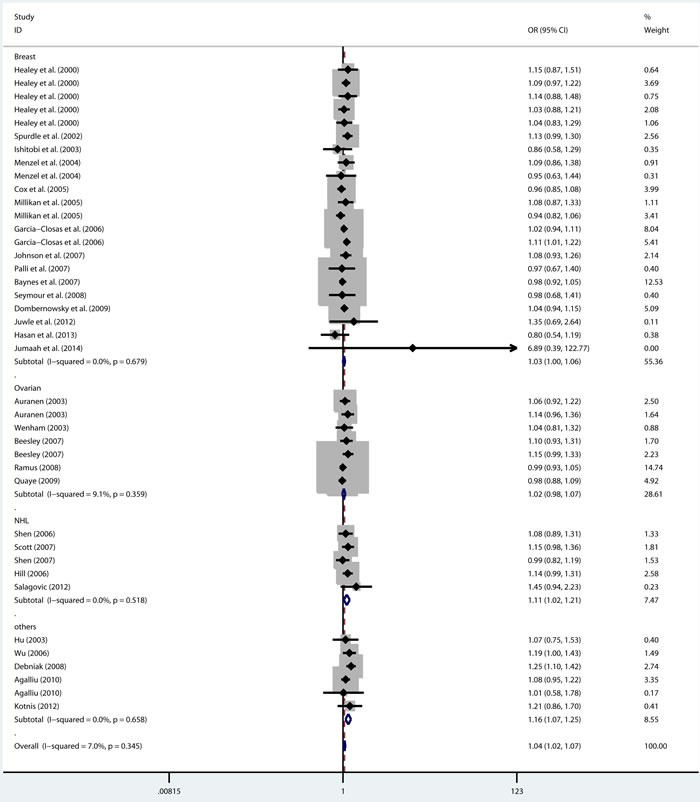
Each square is proportional to the study-specific weight.
Official websites use .gov
A
.gov website belongs to an official
government organization in the United States.
Secure .gov websites use HTTPS
A lock (
) or https:// means you've safely
connected to the .gov website. Share sensitive
information only on official, secure websites.
Each square is proportional to the study-specific weight.