
Figure 3. Forest plot for pooled ORs for the associations between additive model (NH vs NN) of rs144844 and cancer risk in the overall population.
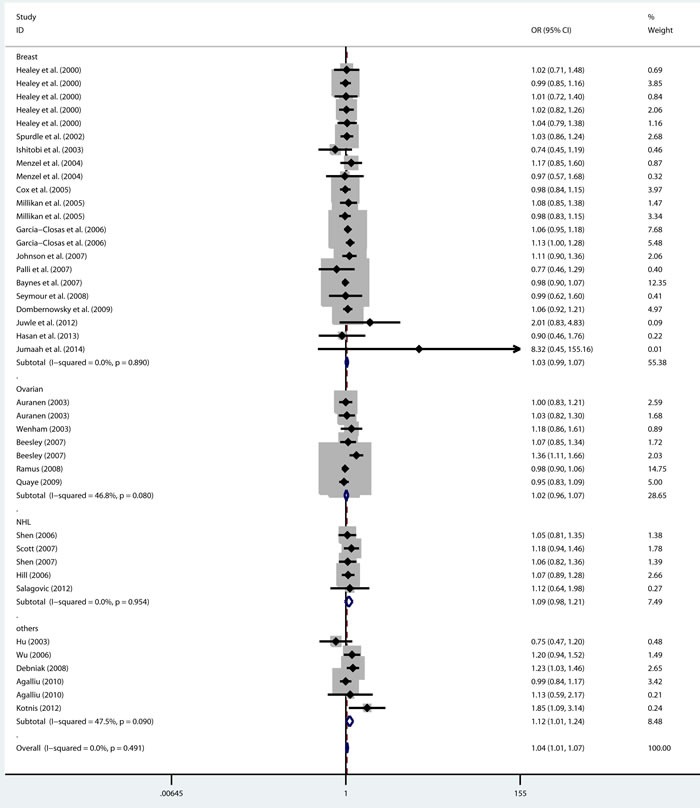
Each square is proportional to the study-specific weight.
Official websites use .gov
A
.gov website belongs to an official
government organization in the United States.
Secure .gov websites use HTTPS
A lock (
) or https:// means you've safely
connected to the .gov website. Share sensitive
information only on official, secure websites.
Each square is proportional to the study-specific weight.