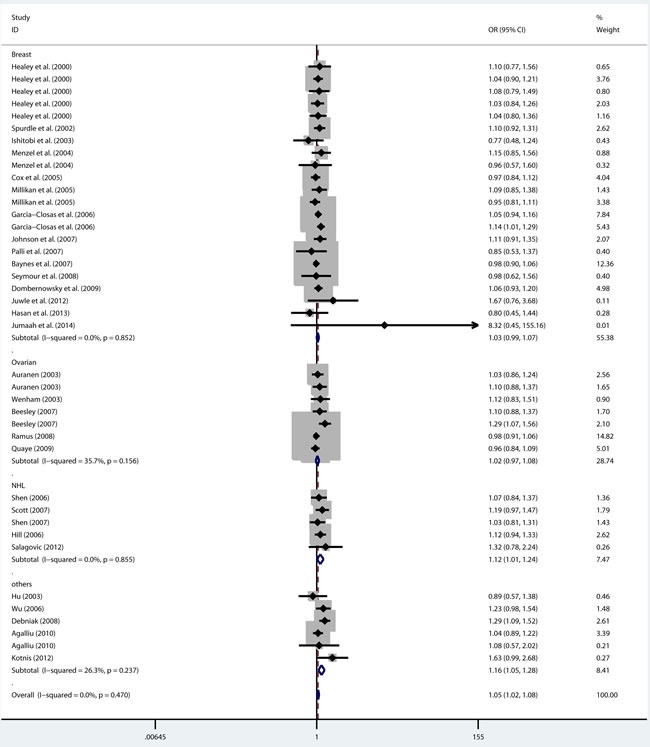
Figure 5. Forest plot for pooled ORs for the associations between dominant model (NH+HH vs NN) of rs144844 and cancer risk in the overall population.

Each square is proportional to the study-specific weight.

Each square is proportional to the study-specific weight.