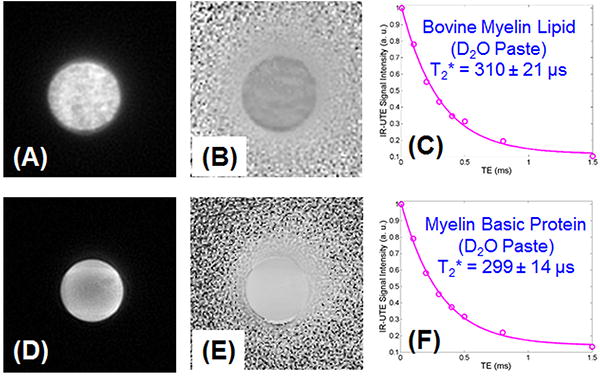
Figure 4.

Magnitude (A) and phase (B) imaging of the bovine myelin lipid powder in D2O suspension, and magnitude (C) and phase (D) imaging of the MBP powder in D2O suspension, as well as exponential fitting of IR-UTE images which shows a short T2* of 310±21 μs for the myelin lipid paste phantom, and a short T2* of 299±14 μs for the MBP paste phantom.
