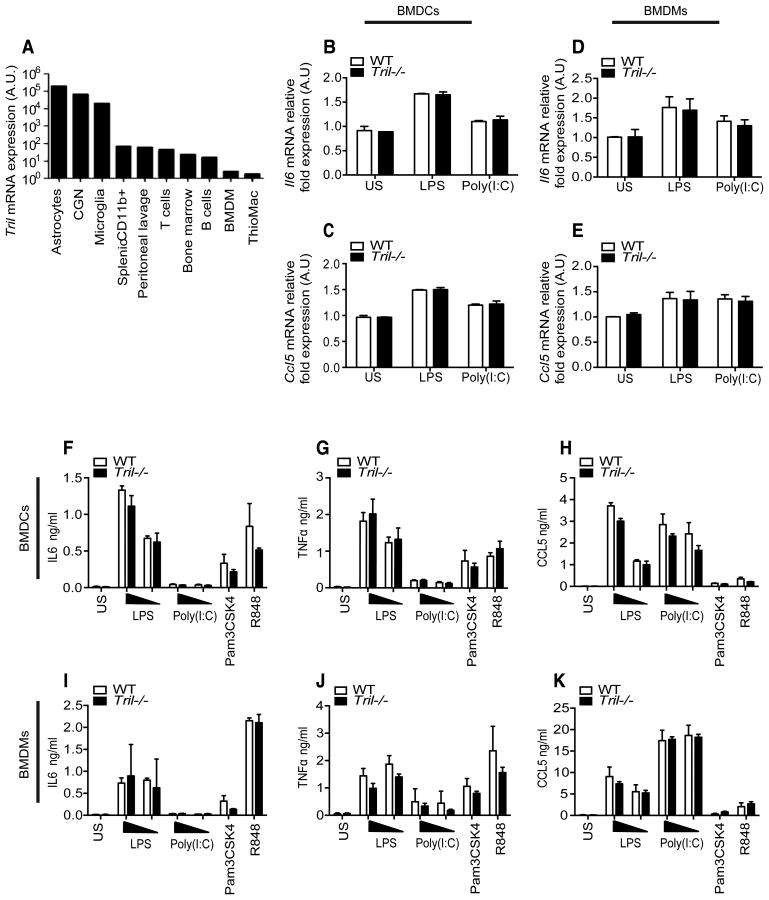
Figure 2. TRIL does not impact TLR mediated responses in bone marrow-derived macrophages (BMDMs) and dendritic cells (BMDCs).
A, Tril expression in various mouse cells populations measured by RT-PCR. Tril expression levels were normalized to Gapdh and expressed relative to the lowest detectable sample. B-E, Expression of Il6 (B and D) and Ccl5 (C and E) in primary BMDCs (left panel) and BMDMs (right panel) isolated from wild type (WT) and Tril-/- mice untreated or stimulated for 5 h with LPS (100ng/ml) or Poly(I:C) (25μg/ml). mRNA levels were normalized to beta-Actin and represented in arbitrary units (A.U) relative to unstimulated cells. F-K, ELISA for IL6 (F and I), TNFα (G and J) and CCL5 (H and K) measured in primary BMDCs (top panel) and BMDMs (bottom panel) derived from WT and Tril-/- mice stimulated for 24 h with LPS (10 and 100ng/ml), Poly(I:C) (25 and 50μg/ml), Pam3CSK4 (100nM) or R848 (1μg/ml). Data are presented as the mean ± SEM of two independent experiments carried out in triplicates.

