Figure 6.
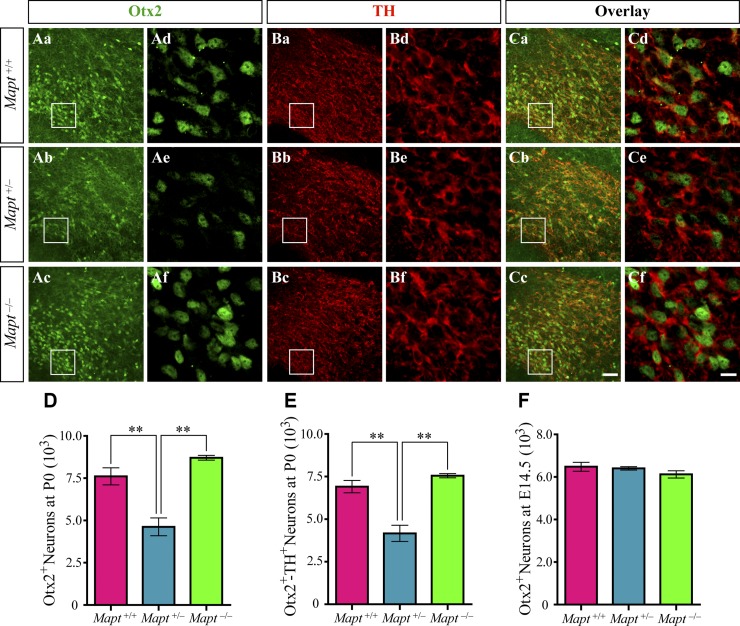
Otx2 expression is reduced in the VTA of Mapt+/− mice at P0. Aa–f) Representative images show Otx2 (green) immunofluorescence staining in VTA of Mapt+/+ (Aa, d), Mapt+/− (Ab, e), and Mapt−/− (Ac, f) mice at P0. Ad–f) Enlarged areas demarcated by the insets in Aa–c. Ba–f) Representative images show TH (red) immunofluorescence staining in VTA of Mapt+/+ (Ba, d), Mapt+/− (Bb, e), and Mapt−/− (Bc, f) mice at P0. Bd–f) Enlarged areas demarcated by the insets in Ba–c. Ca–f) Representative images show the overlay of Otx2 (Aa–f) and TH (Ba–f) immunofluorescence staining in VTA of Mapt+/+, Mapt+/−, and Mapt−/− mice at P0. Cd–f) Enlarged areas demarcated by the insets in Ca–c). Scale bars, 50 μm (Aa–c, Ba–c, Ca–c); 10 μm (Ad–f, Bd–f, Cd–f). D) Number of Otx2+ neurons in VTA of P0 mice. E) Number of Otx2 and TH double-positive neurons in VTA of P0 mice. F) Number of Otx2+ neurons in midbrains of E14.5 mice (n = 5 for each genotype vs. control littermates). Data are means ± sem. **P < 0.01.

