Figure 6.
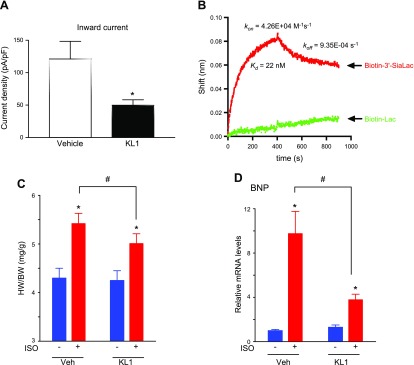
A) Whole-cell recording of OAG-stimulated TRPC6 currents expressed in HEK cells with KL1 domain (300 nM) or vehicle. Experimental paradigm is as Fig. 5A, B. Means ± sem of multiple recordings are shown (n = 6 each). *P < 0.01 KL1 vs. vehicle. B) Binding of KL1 domain to α2-3-sialyllactose analyzed by biolayer interferometry. Spectral shifts of reflected light due to changes in biosensor thickness (Δλ; nm) were measured after 170 nM KL1 domain binding to streptavidin sensors loaded with 150 nM biotin-labeled α2-3-sialyllactose or lactose against biotindiol reference. Similar results were observed in 2 experiments. C, D) Heart weight/body weight ratio (C) and BNP gene expression (D) of mice with or without ISO to induce cardiac hypertrophy, and after intraperitoneal administration of KL1 or vehicle. *P < 0.01 +ISO vs. −ISO; #P < 0.05 between indicated groups.

