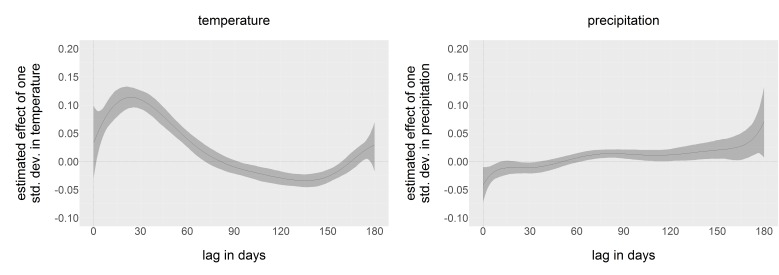
Estimated dependence functions.
Dependence of county-week positivity on temperature and precipitation in the past six months, estimated by distributed lags. Estimates have been standardized by the standard deviation of temperature and precipitation, so that dependence on temperature and precipitation are directly comparable. 95% confidence intervals are in grey.

