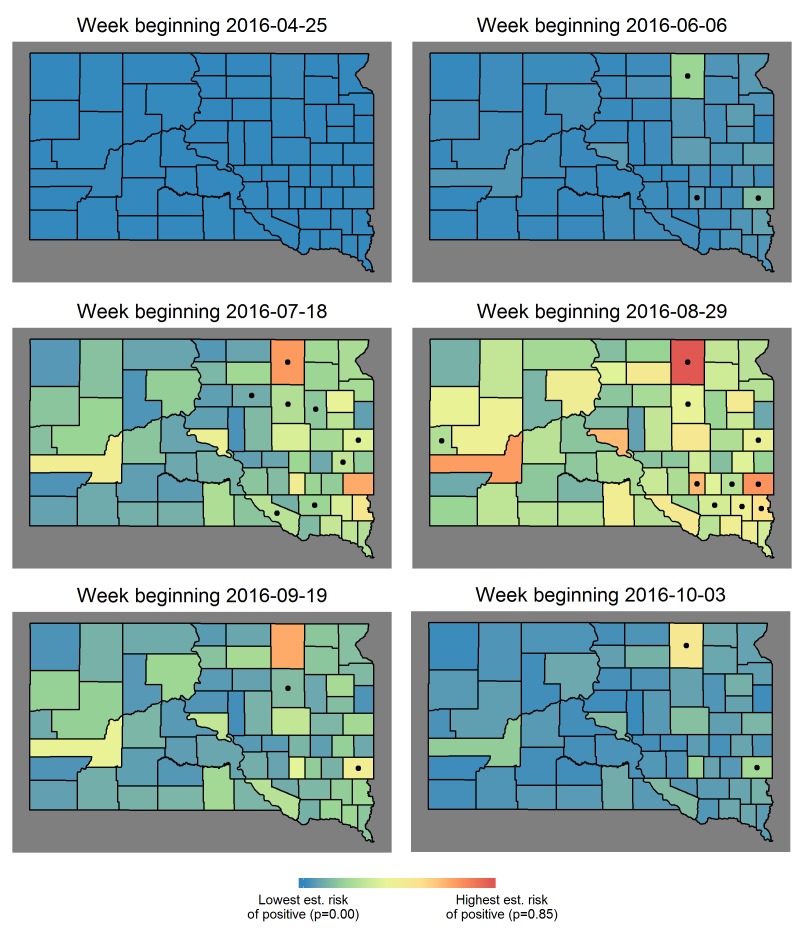
Examples of short-term, spatial predictions.
Six weekly estimates of human risk during 2016, an outbreak year in SD. Estimated weekly risk reached its highest point over the entire study period (represented by red), which occurred in early August 2012 and was nearly reached again in 2016. Dots indicate at least one human case was reported in that county, that week.

