. 2017 May 23;9:ecurrents.outbreaks.90e80717c4e67e1a830f17feeaaf85de. [Version 1] doi: 10.1371/currents.outbreaks.90e80717c4e67e1a830f17feeaaf85de

Whole-year, statewide predictions in 2016.

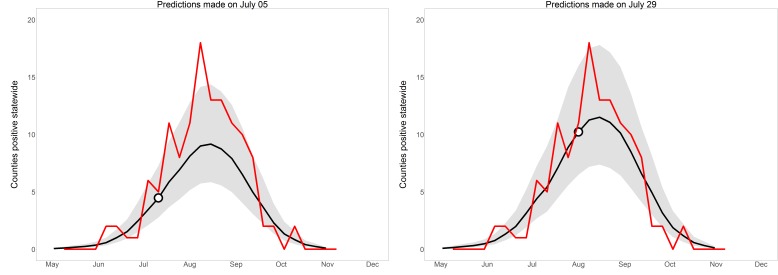
Statewide whole-year predictions in 2016, made on two dates early in the 2016 WNV season. Observed positive county-weeks, reported in December, are in red. Model predictions are in black, with 95% prediction intervals in grey. Dots indicate the slice of the whole-year predictions that contributed to the one-week-ahead, short-term predictions; each whole-year prediction provided one such short-term view.

Statewide whole-year predictions in 2016, made on two dates early in the 2016 WNV season. Observed positive county-weeks, reported in December, are in red. Model predictions are in black, with 95% prediction intervals in grey. Dots indicate the slice of the whole-year predictions that contributed to the one-week-ahead, short-term predictions displayed in Figure 4; each whole-year prediction provided one such short-term view.