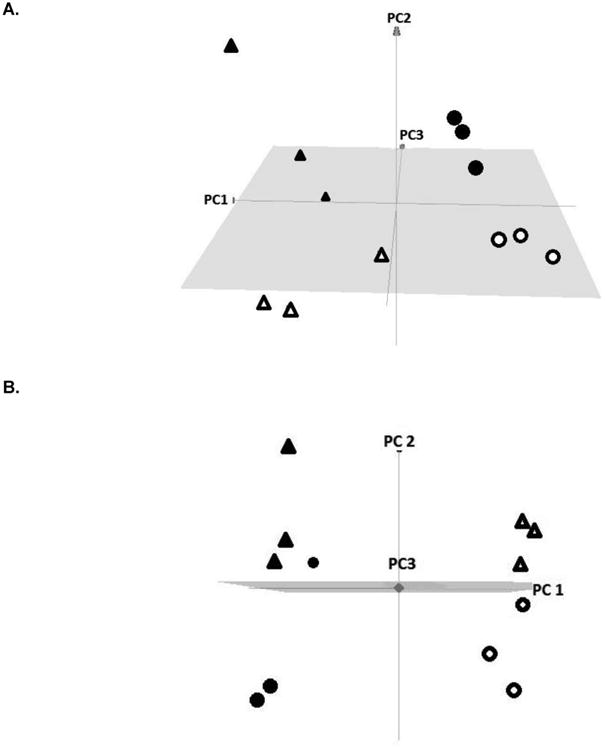
Figure 2.

Principal Component analyses of lipodomic results.
A. Experiment comparing normal colon tissue from control rats and tumor tissue from rats treated with carcinogen. In each group, rats were fed either the Western fat or fish oil diet. Principal component 1 (PC1, tissue type) accounted for 32% of the variance, PC2 (diet) for 28% of the variance and PC3 for 17% of the variance. Legend: Solid sphere, normal tissue from control rats fed the fish oil diet; Open circle, normal tissue from control rats fed the Western fat diet; Solid triangle, tumor tissue from rats fed the fish oil diet; Open triangle, tumor tissue from rats fed the Western fat diet.
B. Experiment comparing grossly normal colon tissue from rats treated with carcinogen (AOM and DSS) or not, fed either the Western fat or fish oil diet. Principal component 1 (PC1, diet) accounted for 43% of the variance, PC2 (carcinogen treatment) for 20% of the variance and PC3 for 9% of the variance. Legend: Open circle, normal colon from control rats fed the Western fat diet; Open triangle, normal colon from carcinogen-treated rats fed the Western fat diet; Solid circle, normal colon from control rats fed the fish oil diet; Solid triangle, normal colon from carcinogen-treated rats fed the fish oil diet.
