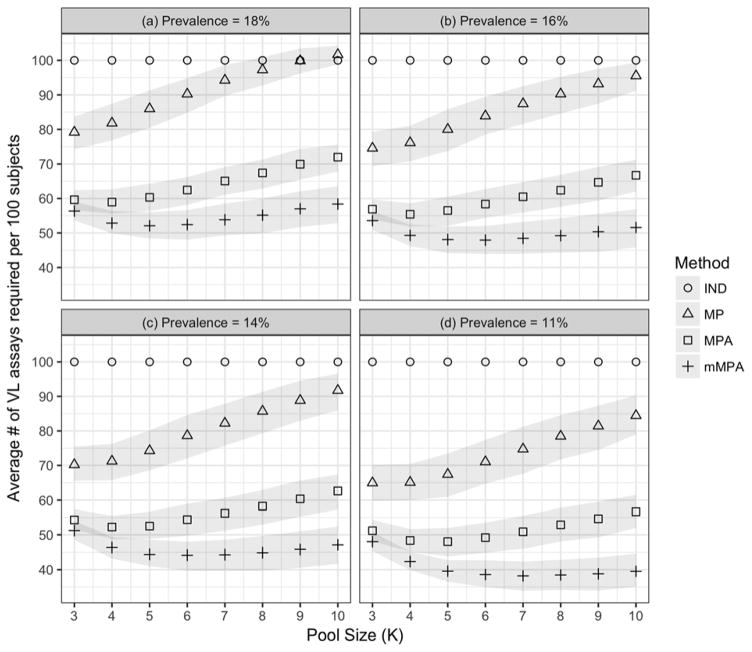
Figure 2. Impact of virological failure prevalence and pool size on pooling deconvolution methods.
The figure demonstrates the impact of pool sizes K (X axis; from 3–10) and viral failure prevalence ((a)=18%; (b)=16%; (c)=14%; and (d)=11%) on the ATR (y axis) according to individual testing (IND; circles), MP (squares), MPA (plus signs) and mMPA (triangles). CD4 is used as a risk score for mMPA. The gray bounds indicate point-wise 95% confidence intervals obtained using the bootstrap method (with 500 resamples) where the intervals are the 2.5 and 97.5 percentiles of the bootstrap distributions.

