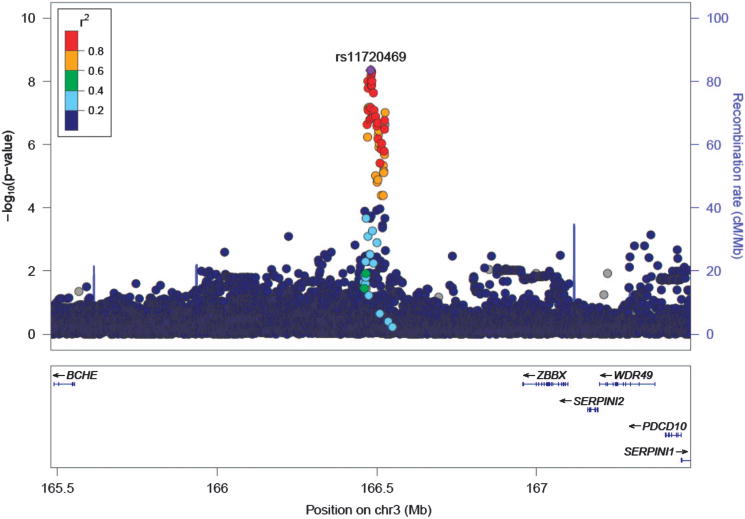
Figure 2.

Association results for fast beta electroencephalogram on chromosome 3q26. y Axis denotes the –log10(P-value) for association. x Axis is the physical position on the chromosome (Mb). The most significantly associated single-nucleotide polymorphism (SNP; rs11720469) is shown in purple. The extent of linkage disequilibrium (LD; as measured by r2) between each SNP and the most significantly associated SNP is indicated by the color scale at the top left. Larger values of r2 indicate greater LD. Circles represent P-values from the African-American ancestry function genome-wide association study sample. LD is based on hg19 1000 Genomes from the African sample.
