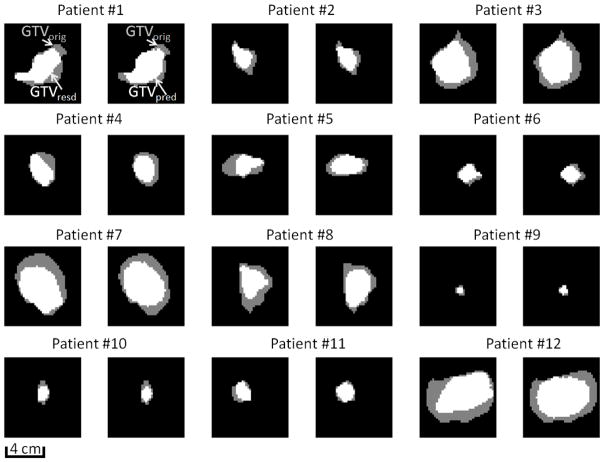
Figure 4.
Representative tumor shrinkage patterns of the twelve patients in the atlas through the transverse cut from the center of gravity of GTVorig. For each patient, the spatial distribution of GTVresd inside GTVorig, and GTVpred inside GTVorig are shown in the first and second cell, respectively. Note that for patient #9, the parenchymal GTV, not the patient’s bigger mediastinal GTV, is selected to show the shrinkage pattern of a small tumor.

