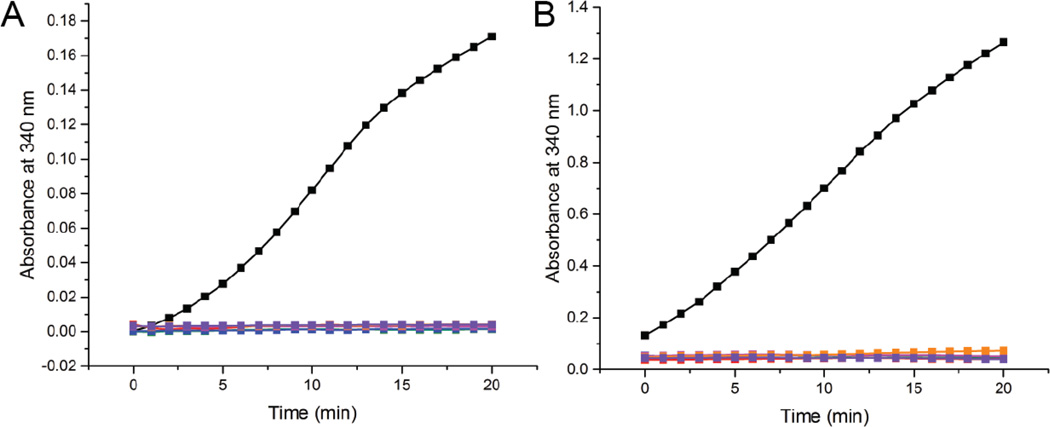
Figure 2. Enzymatic activity of interface mutants compare to wild-type ALDH7A1.
NADH formation was monitored at 340 nm using either 0.5 µM protein and 2 mM AASAL (A) or 4 µM protein and 30 mM AASAL (B). The color scheme in both panels is identical: wild type ALDH7A1 (black), A129P (green), G137V (red), G138V (blue), A149E (magenta), G255D (orange), and G263E (purple). The NAD+ concentration was 2.5 mM. Note that the vertical scales are different in the two panels. The enzyme concentrations were calculated using the molecular weight of an ALDH7A1 monomer.

