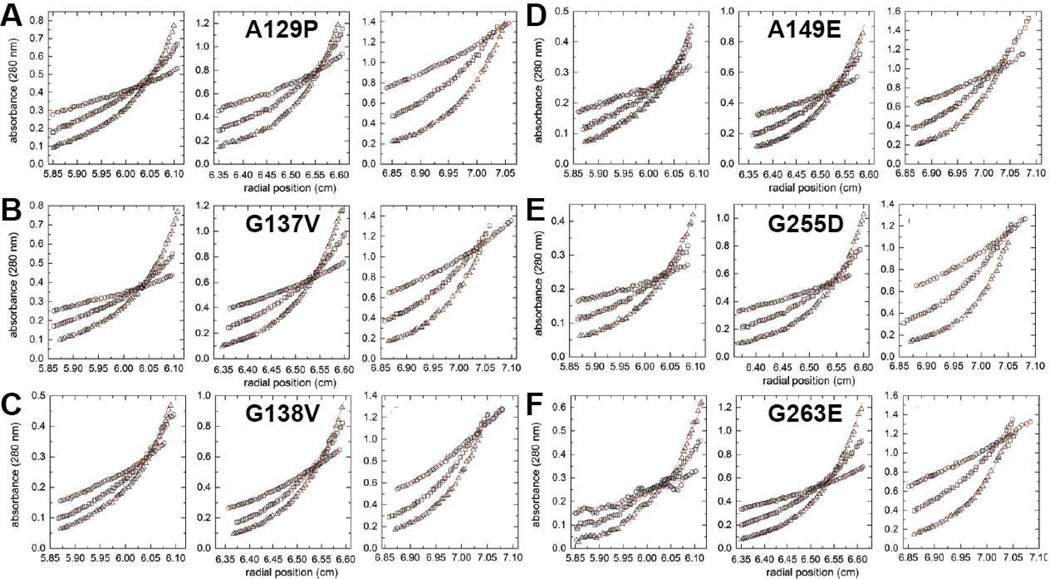
Figure 6. Sedimentation equilibrium analysis for the mutant enzymes.
For each protein, the left, middle, and right graphs show three different concentrations: 0.2 mg/ml (left), 0.4 mg/ml (middle), and 0.8 mg/ml (right). Within each graph, the three data sets correspond centrifugation speeds of 6000 rpm (circles), 9000 rpm (squares), and 12,000 rpm (triangles). The red curves represent global fits of the data to an oligomerization equilibrium model.

