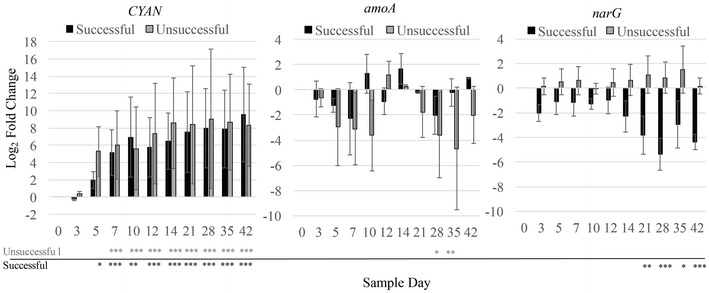
Fig. 6.

Log2 fold change of the target genes CYAN, amoA, and narG using 16S rDNA as a reference and compared to the t = 0 day community. R2 values were >0.98 for all calibrations. qPCR reaction efficiencies were greater than 90%. Significant interaction effects were further determined with Tukey’s HSD test if the ANOVA results were significant (p < 0.05)—*p < 0.05, **p < 0.01, ***p < 0.001)
