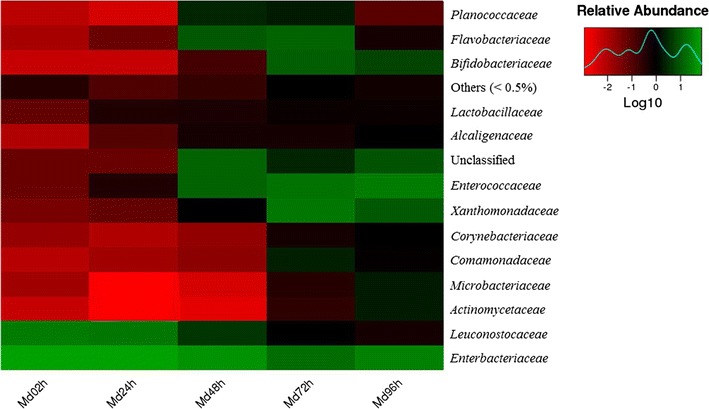
Fig. 2.

Heat maps of the relative abundances and distributions of bacterial families in Musca domestica larvae. The colour code indicates relative abundance, ranging from red (low abundance) to black to green (high abundance). Each treatment included three biological replicates. To minimize the degree of difference in relative abundance values, all values were log transformed
