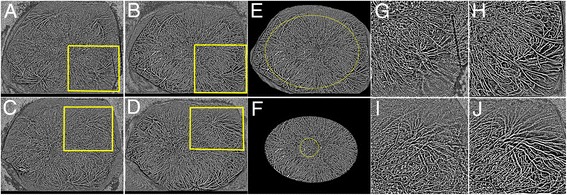
Fig. 6.

Binarized images of wide-field indocyanine green angiograms before and after treatment. a Baseline image in the right eye. b Posttreatment image in the right eye. c Baseline image in the left eye. d Posttreatment image in the left eye. e, f Densitometry of retinal and choroidal vessels. e The same image as b. The yellow oval is drawn through one-disc diameter posterior to the center of the ampullas of vortex veins. f Trimmed image along the yellow oval on e. The yellow circle indicates posterior area within 3 mm from the fovea and the outside of that was considered as the mid-periphery. g, h Magnified images of the yellow square in a or b.i, j Magnified images of the yellow square in c or d. After the therapy, the choroidal vessels were clearly visualized and the narrowed vessels in the acute phase resolved in both eyes
