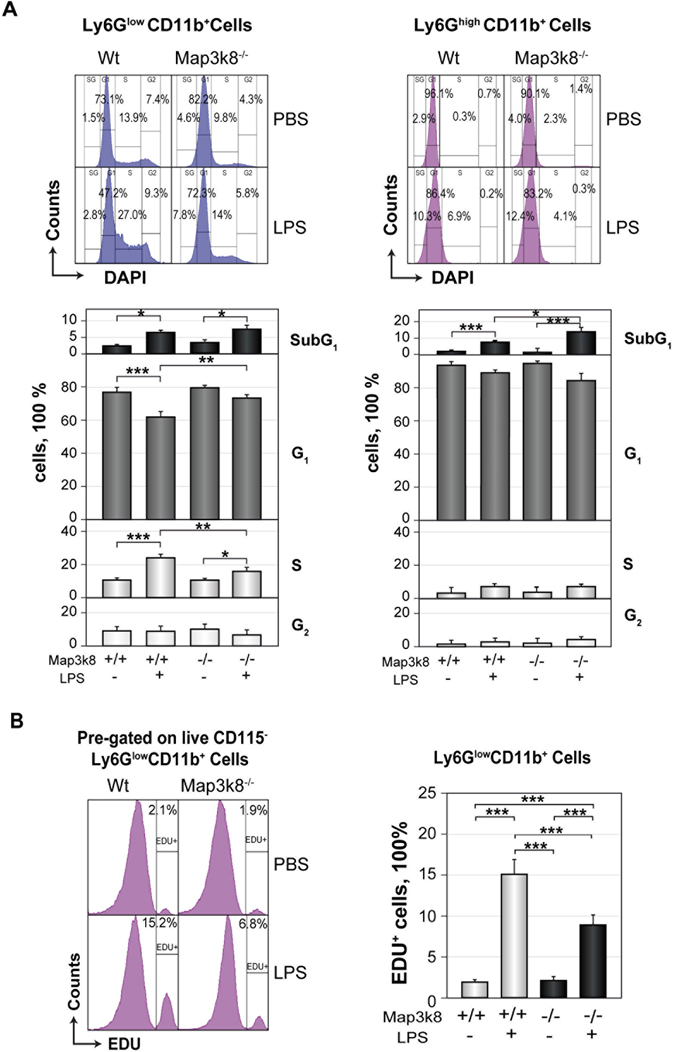
Figure 3.

Map3k8 deficiency slows the cell cycle progression of BM Ly6GlowCD11b+ immature neutrophils in LPS-treated mice. (A) BM cells from Wt and Map3k8−/− untreated and LPS-treated mice were surface-stained, permeabilized and stained with DAPI. Representative histograms depicting the cell cycle distribution of Ly6GlowCD11b+ immature and Ly6GhighCD11b+ mature neutrophils. The lower panels show the percentage of cells in the different phases of the cell cycle. Data from at least 3 independent experiments performed in duplicate are shown. (B) Another set of mice treated as in (A) received an injection of 2′-deoxy-5-ethynyluridine (EDU) 18 h before they were killed. BM cells were surface-stained, permeabilized and subjected to the Click-iT® reaction. Histograms depict a representative analysis of EDU-positive cells among the Ly6GlowCD11b+ immature neutrophil population. The graph on the right shows the frequency of EDU-positive cells among Ly6GlowCD11b+ immature neutrophils. Data from two independent experiments performed in triplicate are presented as the mean ± SEM. Newman-Keuls tests were used to compare groups. *p < 0.05, **p < 0.01, ***p < 0.001.
