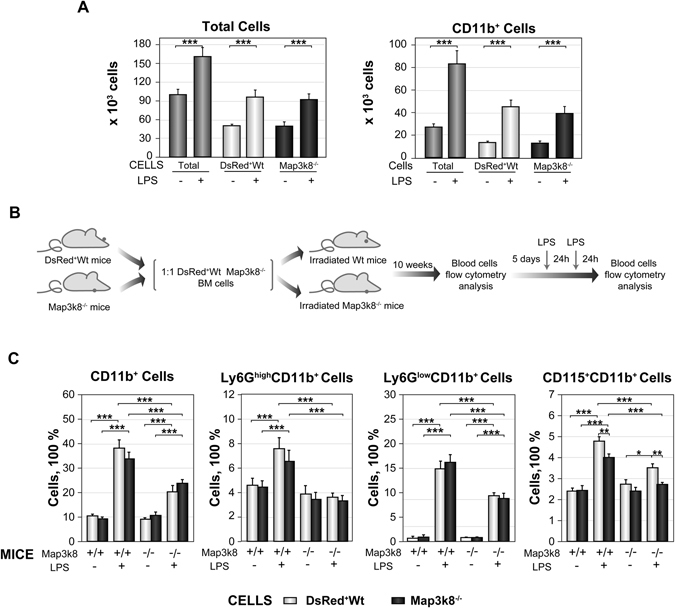
Figure 6.

LPS-induced emergency granulopoiesis requires Map3k8 expression in non-haematopoietic cells. (A) Isolated BM LIN− cells from DsRed+Wt and Map3k8−/− mice were mixed at a 1:1 ratio and used to seed the same MethoCult M3434 plate. Cells were incubated with or without LPS (500 ng/ml) for six days. Total, DsRed+ (Wt) and DsRed− (Map3k8−/−) cells were gated and quantified by flow cytometry. The left panel shows the distribution of total cells, and the right panel shows the distribution of CD11b+ myeloid cells. Data were obtained from two different experiments performed in quadruplicate, and statistical significance is indicated for differences between DsRed+Wt and Map3k8−/− cells with and without LPS treatment only. (B) Diagram of the mixed chimaera approach and LPS treatment. (C) Circulating DsRed+Wt and Map3k8−/− CD11b+ myeloid cells, Ly6GhighCD11b+ mature and Ly6GlowCD11b+ immature neutrophils, and CD11b+CD115+ monocytes from Wt and Map3k8−/− recipient chimaeric mice were analysed before (LPS−) and after (LPS+) LPS treatment. The frequency of the various cells relative to the total number of circulating cells is illustrated (n = 8). Statistical significance is shown for differences between the DsRed+Wt and Map3k8−/− cell types from Wt and Map3k8−/− recipient mice and between the experimental conditions for Wt and Map3k8−/− recipient mice. (A,C) DsRed was used to distinguish Wt and Map3k8−/− cells through the use of an extra gate, DsRed versus FSC-A, identifying Wt cells as DsRed+ and Map3k8−/− cells as DsRed− cells. The data are presented as the mean ± SEM. One-way ANOVA with Newman-Keuls correction was used to compare groups. *p < 0.05, **p < 0.01, ***p < 0.001.
