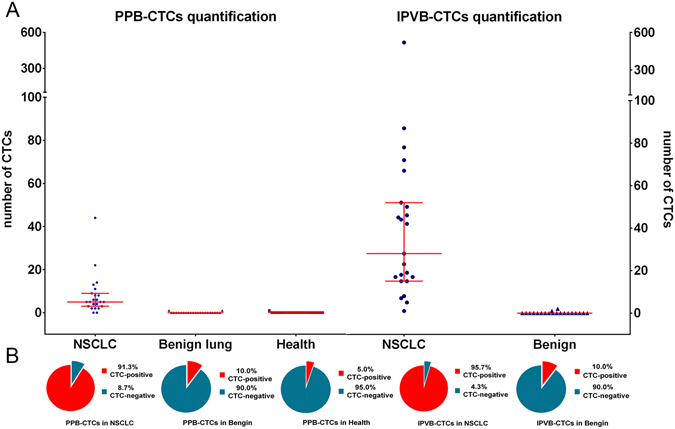
Figure 1.

Analysis of circulating tumor cells in different groups. (A) Scatter plots showing the number of CTCs in different groups drawn using blue points, and the median and interquartile range are indicated by red lines. (B) Pie chart showing the ratio of CTC-positive and CTC-negative patients in different groups. Abbreviations: *CTCs: circulating tumor cells; PPB: preoperative peripheral blood; IPVB: intraoperative pulmonary venous blood; NSCLC: non-small cell lung cancer; Benign: benign lung disease group; Health: health volunteers group.
