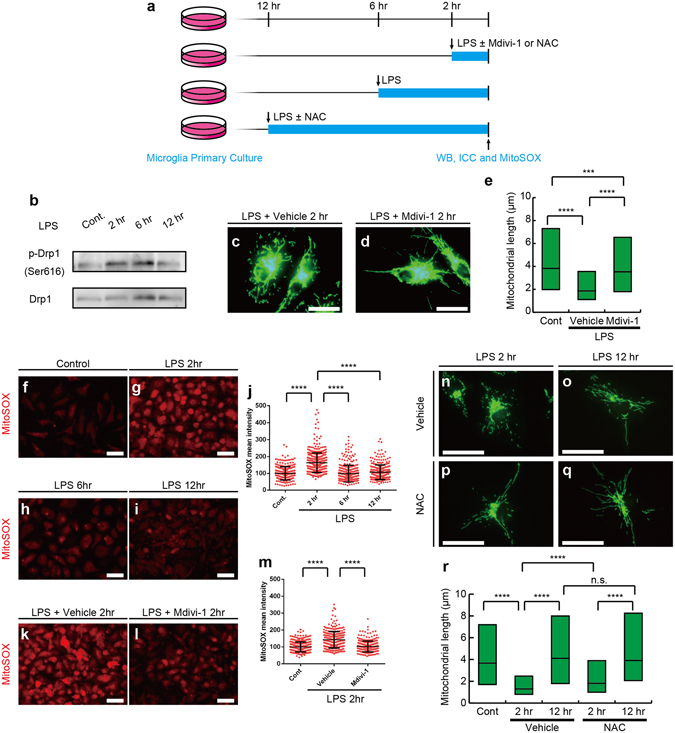
Figure 6.

Lipopolysaccharide (LPS)-induced mitochondrial fragmentation in microglia is controlled by Drp1 signaling and evokes mitochondrial reactive oxygen species (ROS) generation. Primary microglial cultures were incubated without LPS (Cont) or with LPS for 2 (2hr), 6 (6hr) and 12 hr (12hr), and subjected to Western blotting analyses for total Drp1 and Drp1 activated by the phosphorylation at Ser616 (p-Drp1) or MitoSOX analyses to detect mitochondrial ROS (a). Primary microglial cultures were stimulated by LPS for 2 hr with or without an inhibitor for Drp1 (Mdivi-1) or N-acetyl cysteine (NAC) and subjected to immunostaining or MitoSOX analyses (a). Western blotting of phosphorylated Drp1 and total Drp1 following LPS stimulation. (b). Representative images (c,d) and measured lengths (e) of TOM20-immunopositive mitochondrial profiles are shown. N = 2672 (Cont), 5040 (Vehicle), and 2820 (Mdivi-1) mitochondria in (e). MitoSOX images of primary microglial cultures without the LPS stimulation (Cont, f) or with the LPS stimulation for 2 (2hr, g), 6 (6hr, h) or 12 (12hr, i) hr are shown and quantified (j). N = 287 (control), 444 (LPS 2hr), 318 (LPS 6hr) and 309 (LPS 12hr) cells. Each dot represents each cell. Representative images (k,l) and the mean fluorescence intensity (m) of MitoSOX in microglial cultures 2 hr after LPS stimulation with (l) or without (k) Mdivi-1 treatment. N = 336 (Cont), 306 (Vehicle) and N = 297 (Mdivi-1) cells. Representative images (n–p) and measured mitochondrial length (r) after 2hr (n,p) or 12hr (o,q) LPS stimulation of Toll-like receptor 4 (TLR4) with (p,q) or without (n,o) NAC treatment. N = 173 (Cont), 570 (2hr-Vehicle), 411 (12hr-Vehicle), 572 (2hr-NAC), and 364 (12hr-NAC) mitochondria in (r). ***p < 0.001, ****p < 0.0001 and n.s.: not significant in the U-test. Medians (e,j,m,p, bars) with quartile ranges (e,p, boxes; j,m, whiskers) are shown. Bars: 20 μm (c,d, n-q), 50 μm (f–i, k,l).
