
Figure 3.
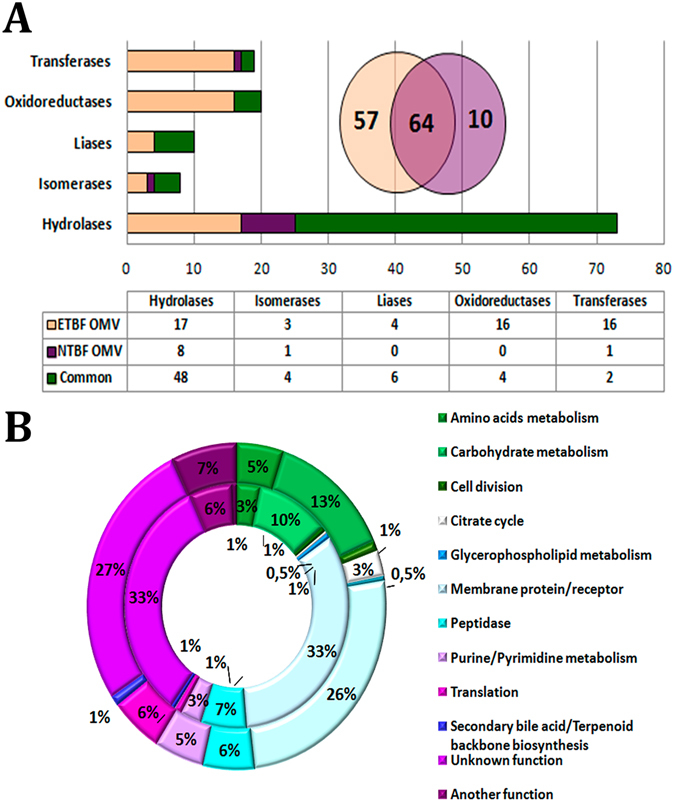
Enzymes identified in both types of vesicles and functional metabolic pathways. (A) The columnar histogram represents distribution of enzymes identified in both types of vesicles according to enzyme class. The Venn diagram represents comparative analysis of the total number of enzymes identified in both types of vesicles. (B) The main pathways and functional groups of proteins identified in both types of vesicles. External histogram—the proteins identified in ETBF OMVs; internal histogram—the proteins identified in NTBF OMV. The number of identified proteins involved in a particular metabolic pathway is represented as the percentage of the total number of proteins identified in ETBF or NTBF OMVs.