
Figure 5.
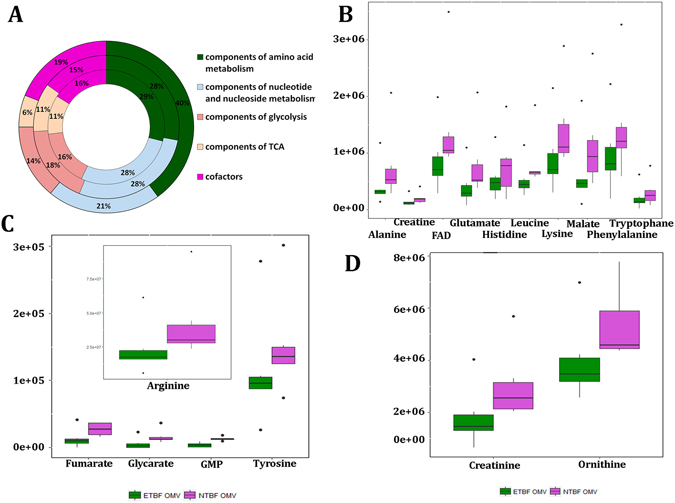
Qualitative and quantitative analyses of ETBF and NTBF metabolites identified in B. fragilis cells and OMVs. (A) Qualitative analysis of metabolites identified in OMVs (external histogram), ETBF cells (middle histogram) and NTBF cells (internal histogram). Metabolites involved in certain metabolic pathways are represented as percentages of the total number of identified in ETBF OMVs/cells and NTBF OMVs/cells metabolites. (B–D) The Box plots show the quantitative differences of the amounts of several metabolites identified in ETBF and NTBF OMVs.