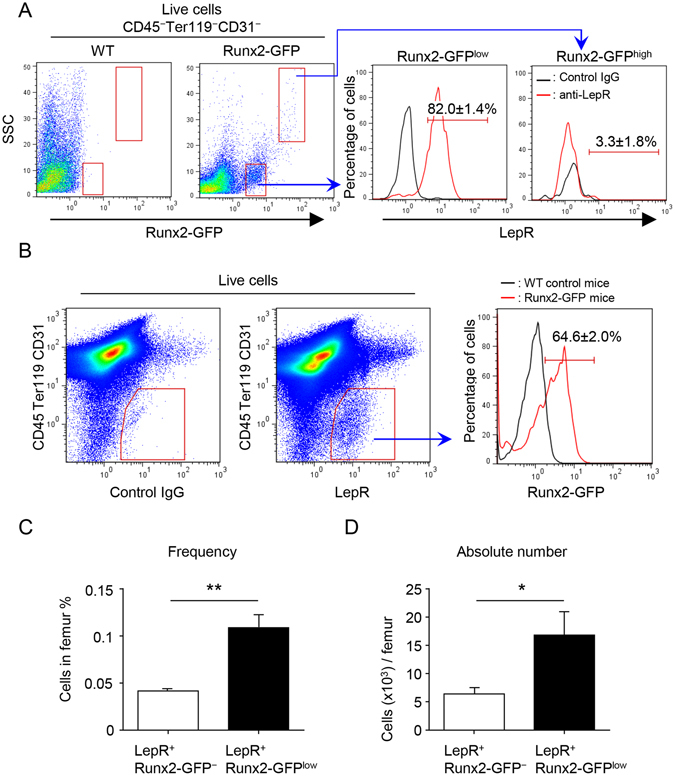
Figure 2.

LepR+ cells contain Runx2-GFPlow and Runx2-GFP− sub-populations. (A) Representative FACS plots (gated on live CD45−Ter119−CD31− cells) showing the expression of LepR in Runx2-GFP+ stromal populations from 5 week-old Runx2-GFP mice. Left panel showing representative FACS plot of WT control (gated on live CD45−Ter119−CD31− cells). Black and red lines represent the isotype control and specific antibody against LepR, respectively. n = 3. (B) Representative FACS plots (gated on live cells) showing frequency of Runx2-GFP+ population in the CD45−Ter119−CD31−LepR+ cell population (right panel) from 5–6 week-old Runx2-GFP mice. Left panel showing negative control for LepR antibody (gated on live cells). Black and red lines represent the WT control and Runx2-GFP mice, respectively (right panel). n = 3. (C and D) Quantification of the frequency (C) and absolute number (D) of Runx2-GFPlow and Runx2-GFP− sub-populations in LepR+ cells (CD45−Ter119−CD31−). n = 3. *P < 0.05, **P < 0.01. Data are represented as mean ± SD.
