Figure 3.

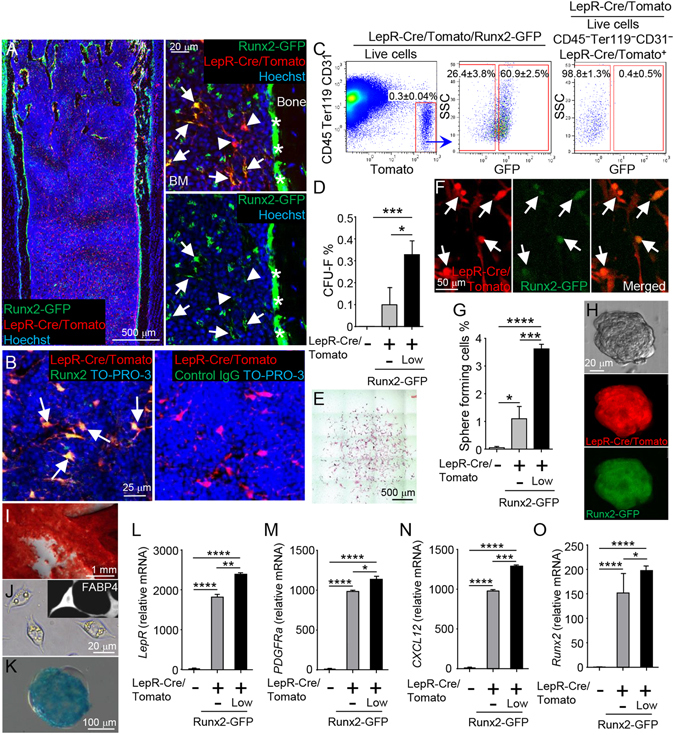
Stromal stem cell activity in BM is enriched in LepR+Runx2-GFPlow population. (A) Z-stack confocal images of thick bone sections of 6 week-old LepR-Cre/Tomato/Runx2-GFP mice. Arrows: LepR-Cre-derived Tomato+ (LepR/Tomato+)/Runx2-GFPlow cells. Arrowheads: LepR/Tomato+/Runx2-GFP− cells. *: Runx2-GFPhigh bone-lining mature osteoblasts. Nuclei were visualized with Hoechst 33342 (blue). (B) Z-stack confocal images of thick bone sections of 6 week-old LepR-Cre/Tomato mice stained with Runx2 (left panel, green) and control IgG (right panel). Arrows: LepR/Tomato+/Runx2+cells. Nuclei are visualized with To-PRO-3 (blue). (C) Representative FACS plots (gated on live cells) showing the percentages of Runx2-GFP-positive (designated as Runx2-GFPlow) and -negative (designated as Runx2-GFP−)cells (middle panel) in the CD45−Ter119−CD31−LepR/Tomato+ stromal population (left panel) from 6 week-old LepR-Cre/Tomato/Runx2-GFP mice. Right panel showing representative FACS plot of control (gated on live CD45−Ter119−CD31−LepR/Tomato+ cells) in 6 week-old LepR-Cre/Tomato mice. (D–O) CD45−Ter119−CD31− stromal cells (gated on live cells) were sorted based on expression of LepR-Cre/Tomato and Runx2-GFP from 6-7 week-old LepR-Cre/Tomato/Runx2-GFP mice, and percentage of CFU-F (D) and clonal sphere (mesensphere) formation (G) were determined. Representative image of CFU-F colony (E; Giemsa staining, F; Tomato and GFP fluorescence). n = 3 independent experiments. Arrows: LepR/Tomato and Runx2-GFP double-positive cells. Representative image of mesensphere formation (H; bright field, Tomato, and GFP fluorescence). n = 3 independent experiments. Differentiation phenotypes of LepR/Tomato+/Runx2-GFPlow cells shown by Alizarin Red S: osteoblasts (I), lipid droplets and staining with FABP4 antibody: adipocytes (J), and Alcian Blue: chondrocytes (K). Expression levels of LepR (L), PDGFRa (M), CXCL12 (N) and Runx2 (O) were measured by quantitative real-time PCR. n = 3–5. *P < 0.05, **P < 0.01, ***P < 0.001, ****P < 0.0001. Data are represented as mean ± SD.
