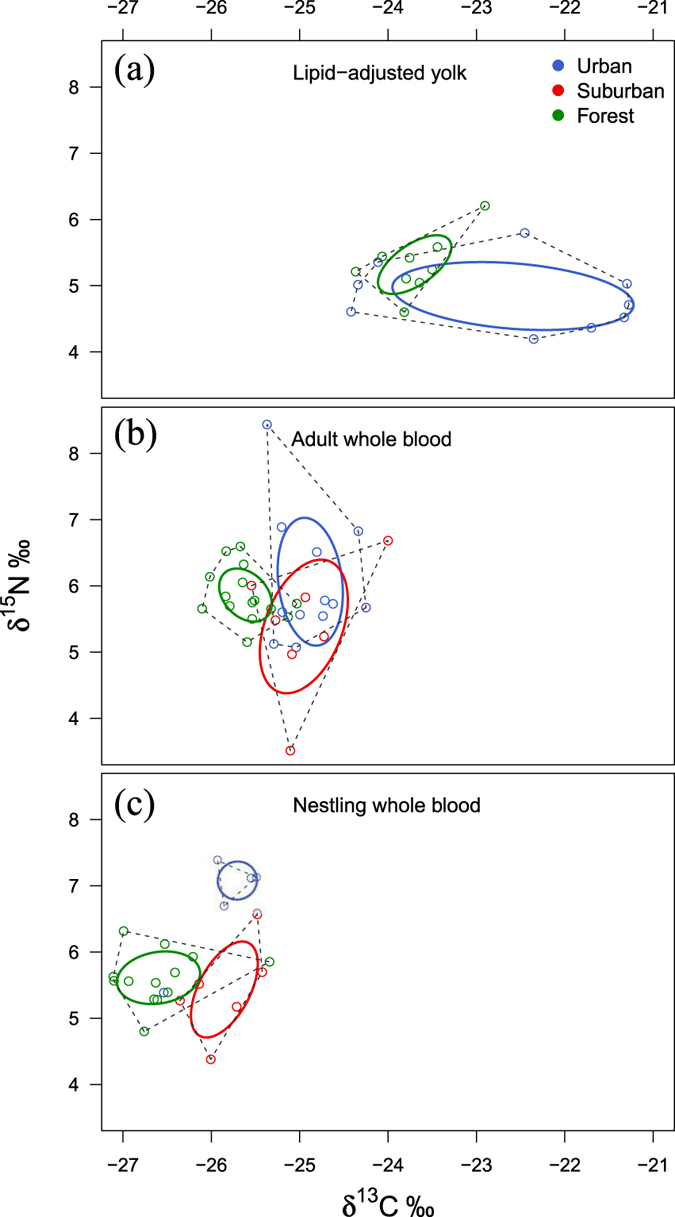
Figure 3.

Isotopic niches extending across δ13C values (x-axis) and δ15N (y-axis) for tissues of blue tits from different sites. Isotopic niches for (a) yolk obtained from blue tit eggs, and for whole blood samples of (b) adults and (c) nestlings from the three study sites. Each dot represents one egg (a), one adult blood sample (b), and one blood sample pooled from 2–4 nestling siblings (c). The broken line represents total convex hull, and the solid ovals are ellipses that include approximately 40% of individuals within a group, which represents the breadth of the isotopic niche in each site.
