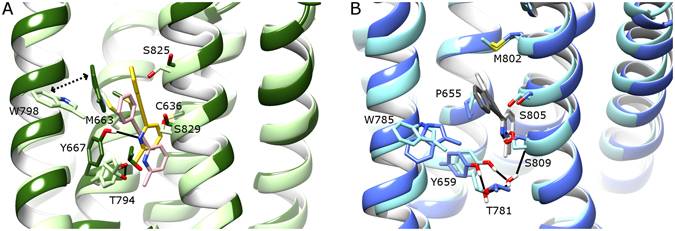
Figure 5.

Comparison of bound MPEP in (A) mGlu4 and (B) mGlu5, before and after respective MD simulations (average conformations calculated from 2.5–5 µs). Colours as follows: (A) MPEP before MD in pink, MPEP after MD in yellow, mGlu4 before MD in light green, mGlu4 after MD in dark green; (B) MPEP before MD in dark grey, MPEP after MD in light grey, mGlu5 before MD in light blue, mGlu5 after MD in blue. Selected residues delineating allosteric pockets or participating in ligand binding are labelled. Protein-ligand H-bonds are represented by solid black lines. The inward movement of W798 in mGlu4 is indicated with a dotted arrow. Helix orientations as follows: TM5 left, TM3 centre-left, TM7 centre-right, TM1 right. TM6 backbone is hidden.
